Global Commodity Market Wrap-Up
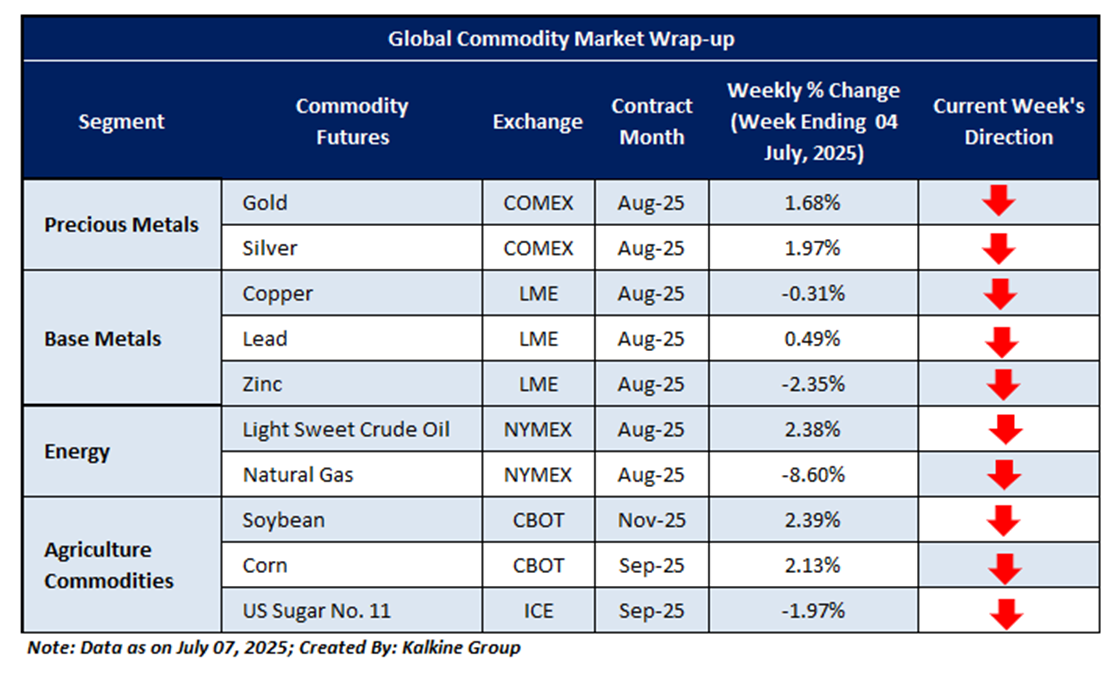
The metals market exhibited mixed trends last week, amid fading momentum and rising geopolitical tensions, which kept investor sentiment cautious. Precious metals saw modest gains as gold rose 1.68% and silver edged up 1.97%, driven by safe-haven demand. In contrast, industrial metals showed divergence copper dipped 0.31%, zinc dropped 2.35%, while lead managed a 0.49% gain. The performance reflects a balance between risk aversion and selective interest in growth-sensitive assets. With key central bank decisions approaching and ongoing global economic uncertainty, metals markets are likely to remain volatile in the coming sessions.
Natural gas prices plunged 8.60% last week, weighed down by supply concerns despite declining seasonal demand. Crude oil posted a modest gain of 2.38%, supported by trade tensions and uncertainty over OPEC’s production strategy. Meanwhile, U.S. sugar prices slipped 1.97%, bucking the broader trend in agricultural commodities. These divergent moves underscore persistent supply-demand imbalances and heightened sensitivity to geopolitical and economic developments. Volatility remains elevated across energy and agriculture markets, with traders closely monitoring global conditions and upcoming policy signals that could shape future price trajectories.
Global commodity prices showed mixed performance last week as markets weighed macroeconomic uncertainty against evolving supply dynamics. Precious metals saw limited upside, with gold and silver consolidating near recent highs amid cautious risk sentiment and shifting rate expectations. Crude oil extended modest gains, supported by ongoing OPEC+ supply concerns and geopolitical tensions, while natural gas prices fell sharply due to oversupply worries. Agricultural commodities traded sideways, reflecting stable demand and favourable weather conditions in key producing regions. Overall, market sentiment remained cautious, with traders closely monitoring upcoming inflation data, central bank policy cues, and global geopolitical developments for further direction.
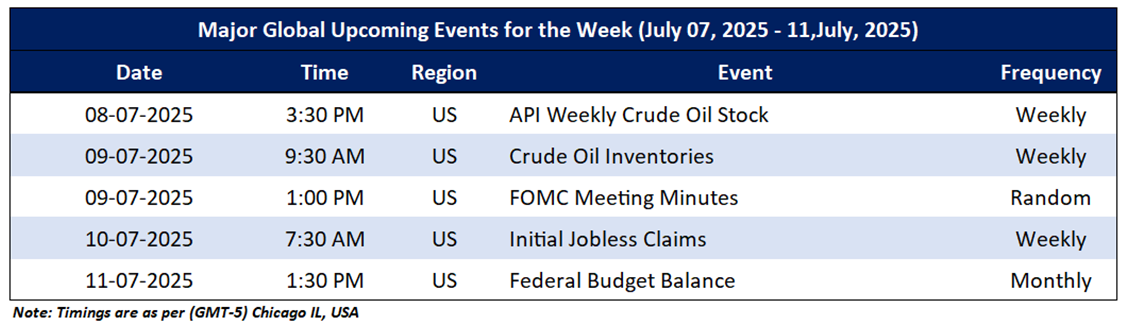
The upcoming Micro and Macroeconomic events that may impact on market sentiments include an update API Weekly Crude Oil Stock, Crude Oil Inventories, FOMC Meeting Minutes and Initial Jobless Claims.
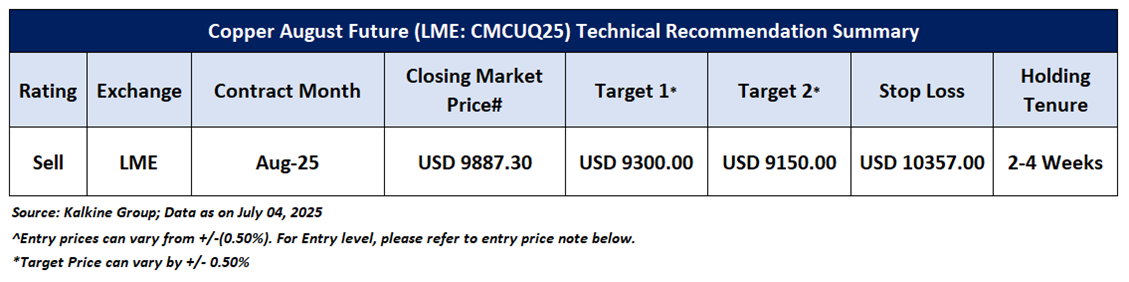
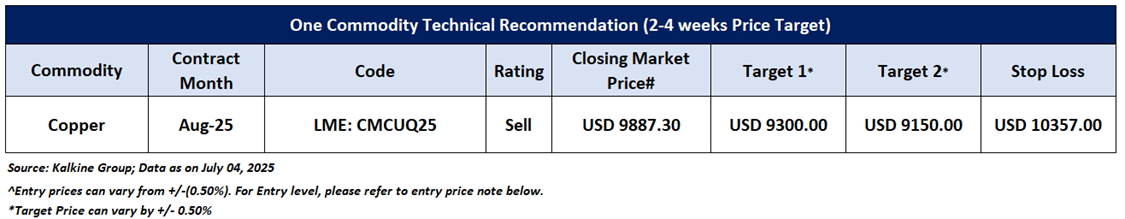
Having understood the global commodities’ performance over the past week, taking cues from major global economic events, and based on technical analysis, noted below is the recommendation with generic insights, entry price, target prices, and stop-loss Copper August Future (LME: CMCUQ25) for the next 2-4-week duration:
Copper August Future (LME: CMCUQ25)
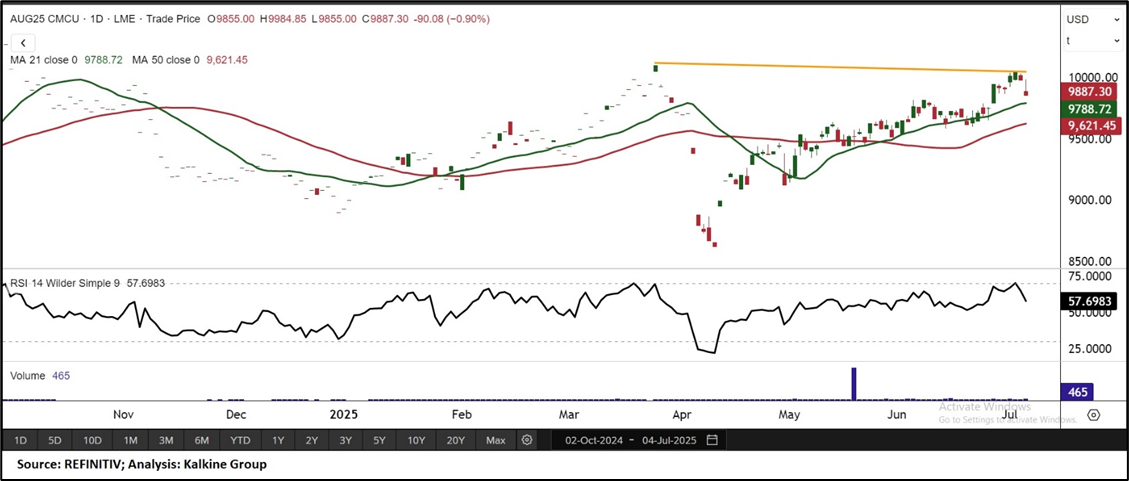
Price Action and Technical Indicator Analysis: August Copper futures display a bearish bias, trading below a descending trendline and marked by a bearish candlestick pattern that reflects sustained downside pressure. The 50-period Simple Moving Average, positioned below the current price, offers a key short-term support level, helping to cushion declines. However, the Relative Strength Index at 57.69 shows neutral-to-weakening momentum, lacking signs of bullish divergence. The overall setup suggests a cautious outlook, where failure to hold above support could deepen the corrective phase. Unless prices break above immediate resistance, the broader trend may remain under pressure with a risk of further downside.
Now the next crucial support levels appear to be at USD 9300.00 and USD 9150.00, and prices may test these levels in the coming periods (2-4 weeks).
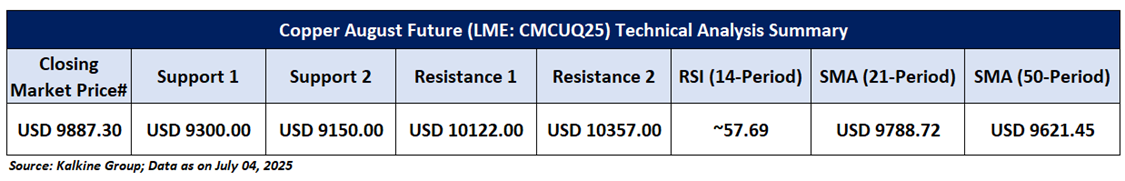
As per the above-mentioned price action and technical indicators analysis, Copper August Future (LME: CMCUQ25) is looking technically well-placed for a ‘Sell’ rating. Investment decisions should be made depending on an individual’s appetite for downside potential, risks, and any previous holdings. This recommendation is purely based on technical analysis, and fundamental analysis has not been considered in this report. Technical summary of the ‘Sell’ recommendation is as follows:
Upcoming Major Global Economic Events
Market events occur on a day-to-day basis depending on the frequency of the data and generally include an update on employment, inflation, GDP, WASDE report, consumer sentiments, etc. Noted below are the upcoming week's major global economic events that could impact commodities’ prices:
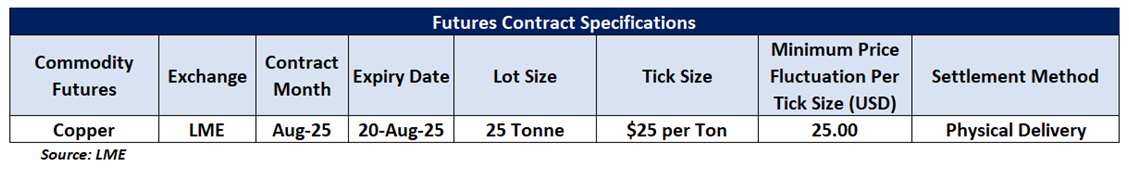
Futures Contract Specifications
Disclaimers
Related Risks: Based on the technical analysis, the risks are defined as per risk-reward ratio (~0.80:1.00), however, returns are generated within a 2-4 weeks’ time frame. This may be looked at by Individuals with sufficient risk appetite looking for returns within short investment duration. The investment recommendations provided in this report are solely based on technical parameters, and the fundamental performance of the commodities has not been considered in the decision-making process. Other factors which could impact commodity prices include market risks, regulatory risks, interest rates risk, currency risks, and social and political instability risks etc.
Note 1: Past performance is not a reliable indicator of future performance.
Note 2: Individuals can consider exiting from the commodity if the Target Price mentioned as per the Technical Analysis has been achieved and subject to the factors discussed above.
Note 3: How to Read the Charts?
The Green colour line reflects the 21-period moving average while the red line indicates the 50- period moving average. SMA helps to identify existing price trend. If the prices are trading above the 21-period and 50-period moving average, then it shows prices are currently trading in a bullish trend.
The Black colour line in the chart’s lower segment reflects the Relative Strength Index (14-Period) which indicates price momentum and signals momentum in trend. A reading of 70 or above suggests overbought status while a reading of 30 or below suggests an oversold status.
The Blue colour bars in the chart’s lower segment show the volume of the commodity. Commodity with high volumes is more liquid compared to the lesser ones. Liquidity in commodity helps in easier and faster execution of the order.
The Orange colour lines are the trend lines drawn by connecting two or more price points and used for trend identification purposes. The trend line also acts as a line of support and resistance.
Technical Indicators Defined: -
Support: A level at which the stock prices tend to find support if they are falling, and a downtrend may take a pause backed by demand or Selling interest. Support 1 refers to the nearby support level for the stock and if the price breaches the level, then Support 2 may act as the crucial support level for the stock.
Resistance: A level at which the stock prices tend to find resistance when they are rising, and an uptrend may take a pause due to profit booking or Selling interest. Resistance 1 refers to the nearby resistance level for the stock and if the price surpasses the level, then Resistance 2 may act as the crucial resistance level for the stock.
Stop-loss: It is a level to protect further losses in case of unfavourable movement in the stock prices.
Risk Reward Ratio: The risk reward ratio is the difference between an entry point to a stop loss and profit level. This report is based on ~80% Stop Loss of the Target 1 from the entry point.
The reference date for all price data, volumes, technical indicators, support, and resistance levels is 04th July 2025. The reference data in this report has been partly sourced from REFINITIV.
Note: Trading decisions require a thorough analysis by individuals. Technical reports, in general, chart out metrics that may be assessed by individuals before any commodity evaluation. The above are illustrative analytical factors used for evaluating the commodity; other parameters can be looked at along with additional risks per side.
Kalkine Equities LLC, with Delaware File Number 4697384, Foreign Qualification Registration in California File Number 202109211078, and Texas File Number 805521396, is authorized to provide general advice only. The information on https://kalkine.com/ does not take into account any of your investment objectives, financial situation or needs. You should consider the appropriateness of advice taking into account your own objectives, financial situation and needs and seek independent financial advice before making any financial decisions. The link to our Terms and Conditions and Privacy Policy has been provided for your reference. On the date of publishing the reports (mentioned on the website), employees and/or associates of Kalkine do not hold positions in any of the stocks covered on the website. These stocks can change any time and readers of the reports should not consider these stocks as advice or recommendations later.
Past performance is not a reliable indicator of future performance.
 Please wait processing your request...