Section 1: Company Fundamentals
1.1 Company Overview and Performance summary
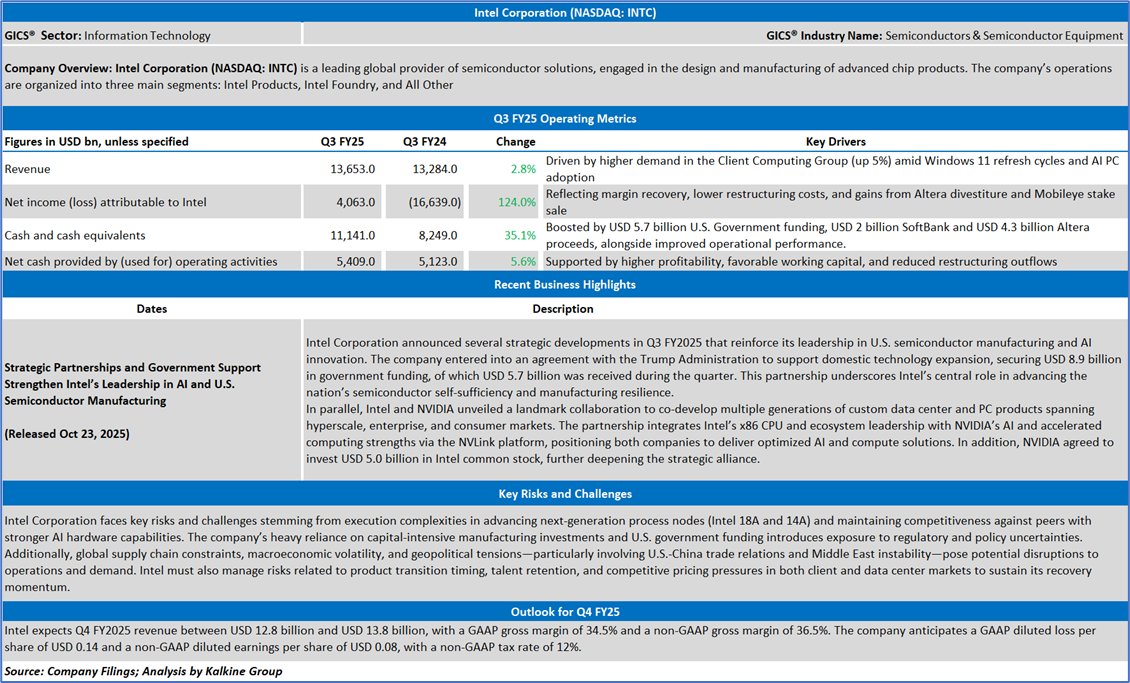
Company Overview:
Intel Corporation (NASDAQ: INTC) is a leading global provider of semiconductor solutions, engaged in the design and manufacturing of advanced chip products. The company’s operations are organized into three main segments: Intel Products, Intel Foundry, and All Other.
This US Inflation Report covers the Company Overview & Price performance, Summary table, Key positives & negatives, Key metrics, Company details, technical guidance & Stock recommendation, and Price chart.
Price Performance:
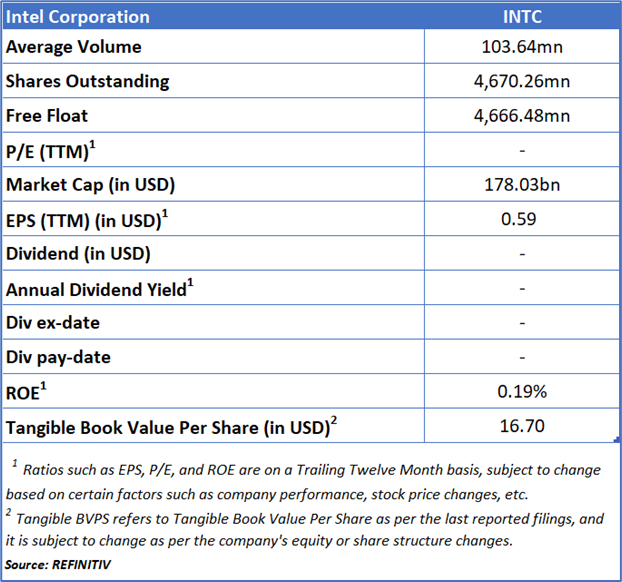
1.2 Summary Table
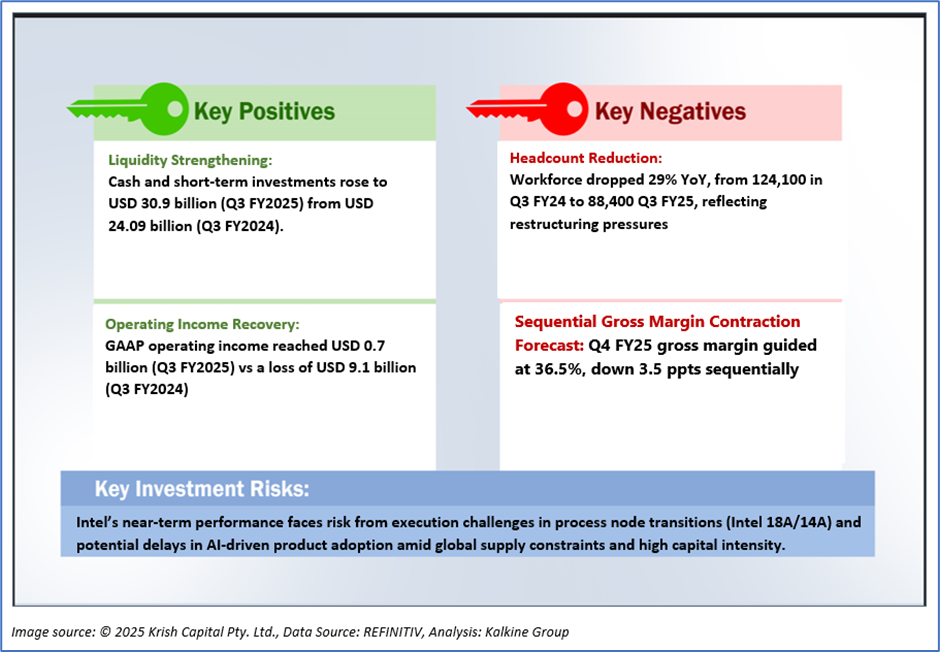
1.3 The Key Positives & Negatives
1.4 Key Metrics
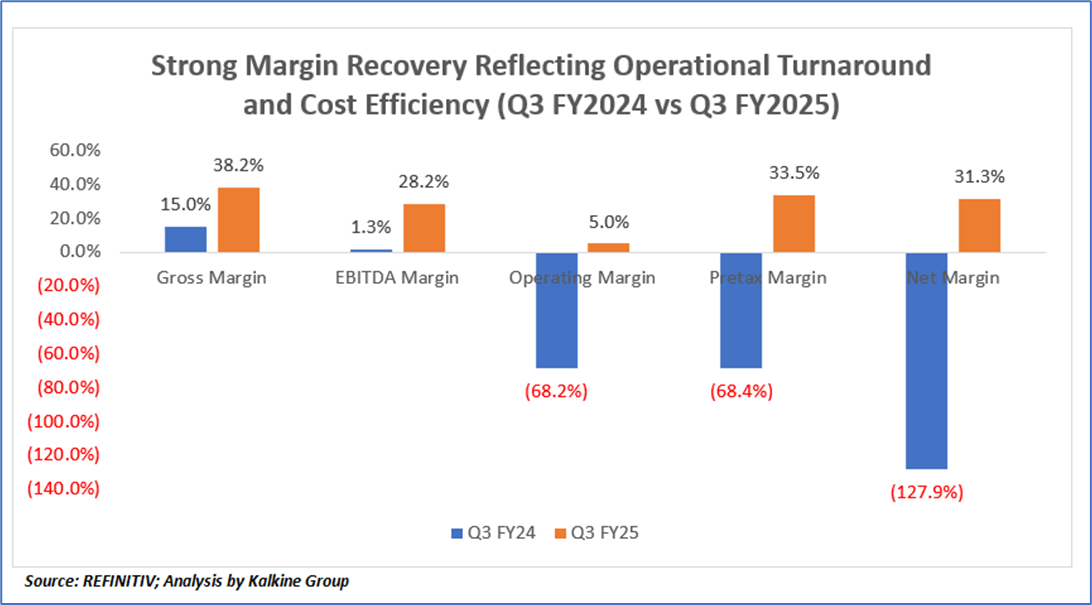
The substantial improvement in Intel Corporation’s margins from Q3 FY2024 to Q3 FY2025 reflects a strong financial and operational turnaround. The rise in gross margin from 15.0% to 38.2% was driven by higher revenue, a favorable product mix, and lower inventory reserves. Enhanced cost efficiency and a 20% reduction in R&D and MG&A expenses contributed to a sharp increase in EBITDA margin from 1.3% to 28.2%. Operating margin rebounded to 5.0% from a loss of 68.2%, largely due to the absence of significant restructuring and impairment charges recorded in the prior year, alongside better pricing and product execution. Pretax and net margins also strengthened markedly, supported by gains from the Altera divestiture, Mobileye stake sale, and inflows from strategic partners, including USD 5.7 billion from the U.S. Government, USD 5.0 billion from NVIDIA, and USD 2.0 billion from SoftBank. Collectively, these factors underscore Intel’s improved cost discipline, successful restructuring, enhanced liquidity, and stronger operational performance, marking a decisive recovery from the losses experienced in the previous fiscal year.
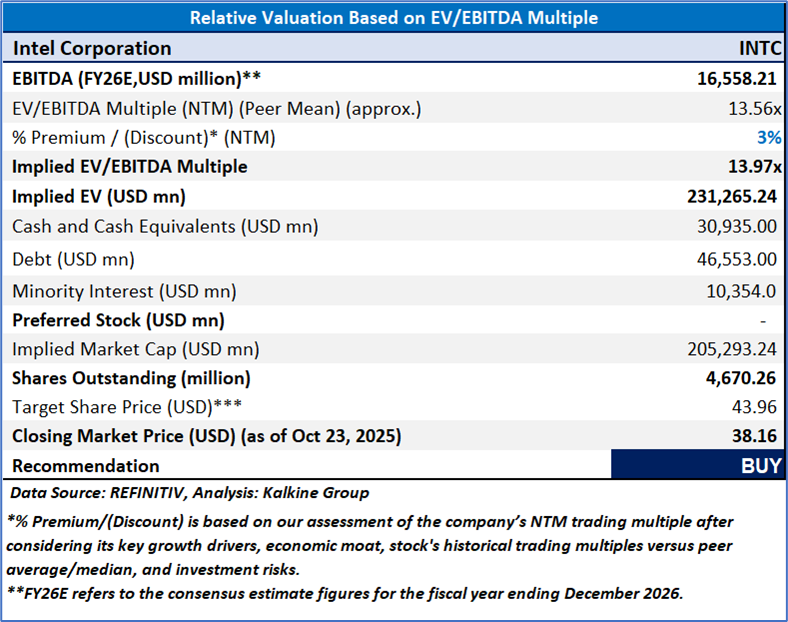
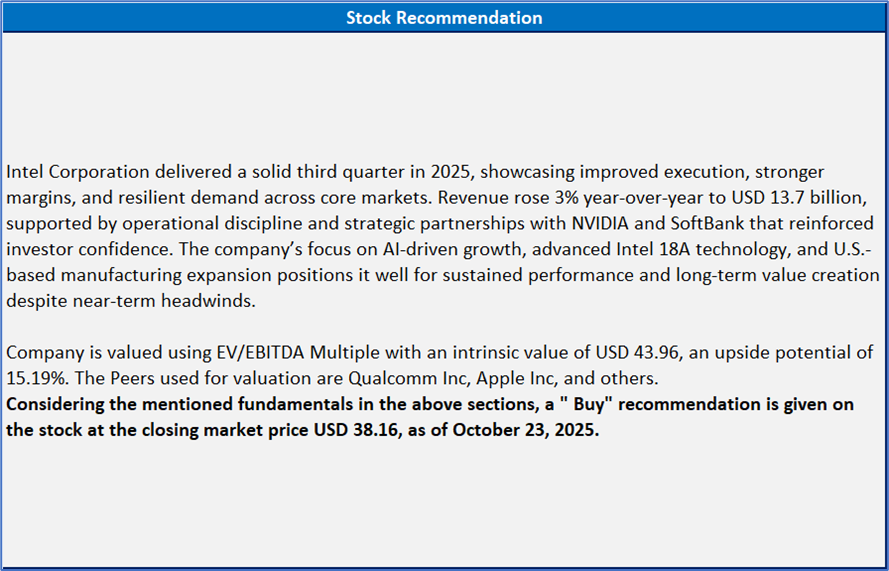
Section 2: Intel Corporation (NASDAQ: INTC) (“Buy” at the closing market price of USD 38.16, as of October 23, 2025)
2.1 Company Details
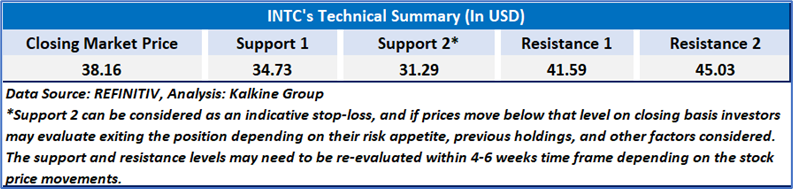
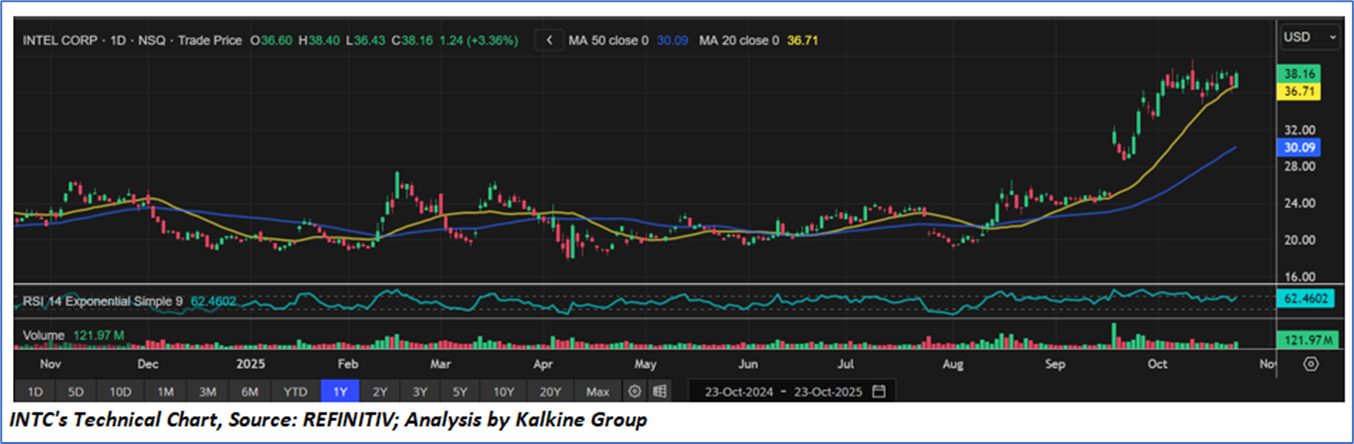
2.2 Technical Guidance and Stock Recommendation
Markets are trading in a highly volatile zone currently due to certain macroeconomic issues and geopolitical tensions prevailing. Therefore, it is prudent to follow a cautious approach while investing.
Note 1: Past performance is not a reliable indicator of future performance.
Note 2: The reference date for all price data, currency, technical indicators, support, and resistance levels is Oct 23, 2025. The reference data in this report has been partly sourced from REFINITIV.
Note 3: Investment decisions should be made depending on an individual's appetite for upside potential, risks, holding duration, and any previous holdings. An 'Exit' from the stock can be considered if the Target Price mentioned as per the Valuation and or the technical levels provided has been achieved and is subject to the factors discussed above.
Note 4: The report publishing date is as per the Pacific Time Zone.
Technical Indicators Defined: -
Support: A level at which the stock prices tend to find support if they are falling, and a downtrend may take a pause backed by demand or buying interest. Support 1 refers to the nearby support level for the stock and if the price breaches the level, then Support 2 may act as the crucial support level for the stock.
Resistance: A level at which the stocks prices tend to find resistance when they are rising, and an uptrend may take a pause due to profit booking or selling interest. Resistance 1 refers to the nearby resistance level for the stock and if the price surpasses the level, then Resistance 2 may act as the crucial resistance level for the stock.
Stop-loss: It is a level to protect against further losses in case of unfavorable movement in the stock prices.
Kalkine Equities LLC, with Delaware File Number 4697384, Foreign Qualification Registration in California File Number 202109211078, and Texas File Number 805521396, is authorized to provide general advice only. The information on https://kalkine.com/ does not take into account any of your investment objectives, financial situation or needs. You should consider the appropriateness of advice taking into account your own objectives, financial situation and needs and seek independent financial advice before making any financial decisions. The link to our Terms and Conditions and Privacy Policy has been provided for your reference. On the date of publishing the reports (mentioned on the website), employees and/or associates of Kalkine do not hold positions in any of the stocks covered on the website. These stocks can change any time and readers of the reports should not consider these stocks as advice or recommendations later.
Past performance is not a reliable indicator of future performance.
 Please wait processing your request...