
Section 1: Company Fundamentals
1.1 Company Overview and Performance summary
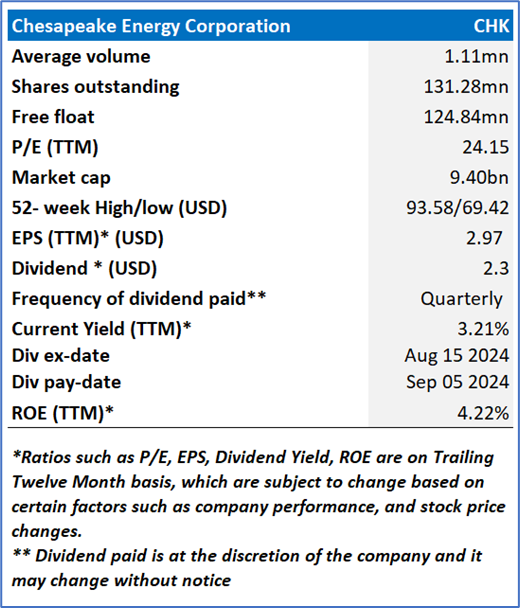
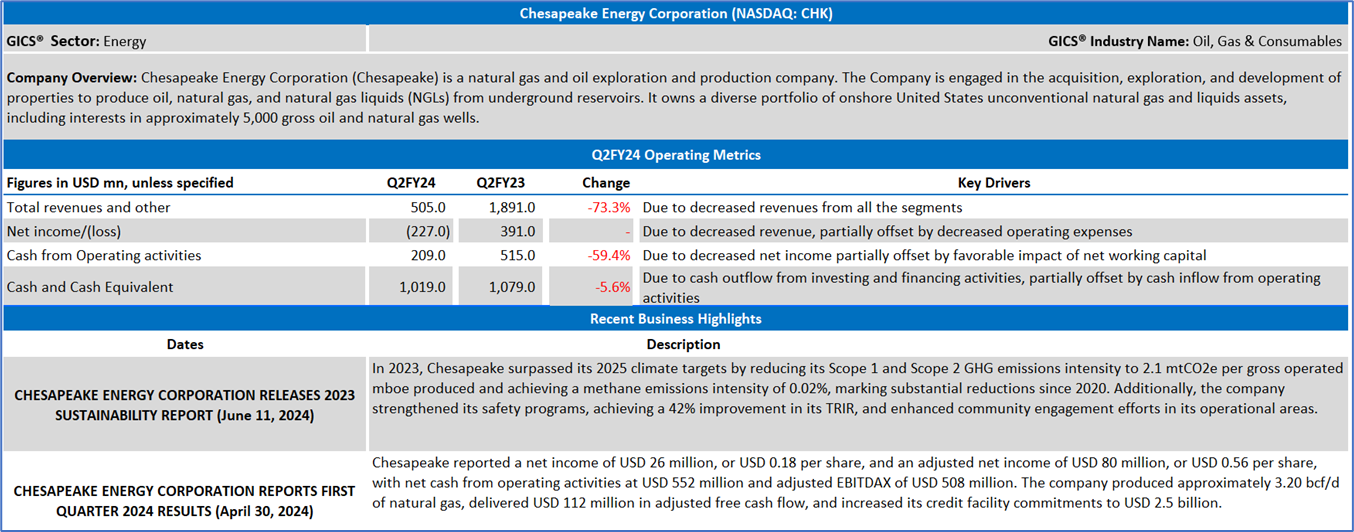
Company Overview:
Chesapeake Energy Corporation (Chesapeake) (NASDAQ: CHK) is a natural gas and oil exploration and production company. The Company is engaged in the acquisition, exploration, and development of properties to produce oil, natural gas, and natural gas liquids (NGLs) from underground reservoirs. It owns a diverse portfolio of onshore United States unconventional natural gas and liquids assets, including interests in approximately 5,000 gross oil and natural gas wells.
This US Inflation Report covers the Company Overview & Price performance, Summary table, Key positives & negatives, Key metrics, Company details, technical guidance & Stock recommendation, and Price chart.
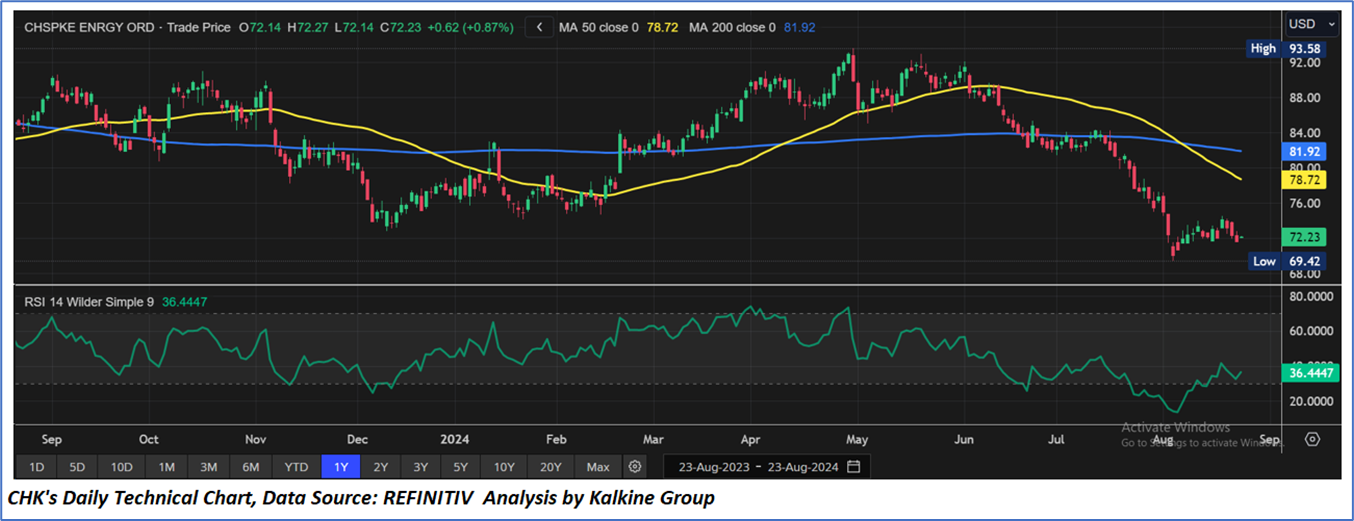
Price Performance:
1.2 Summary Table
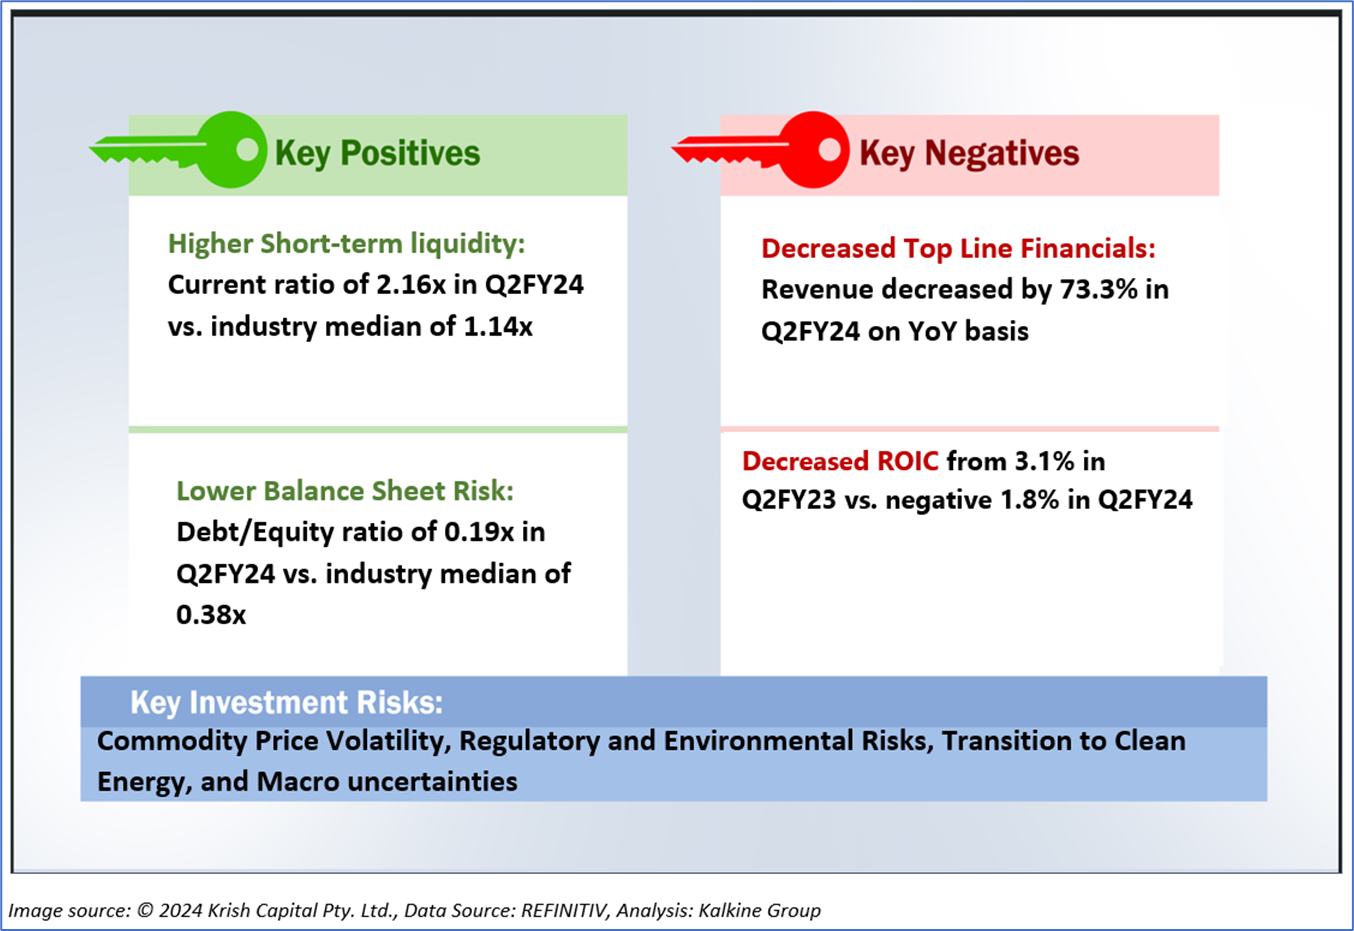
1.3 The Key Positives & Negatives
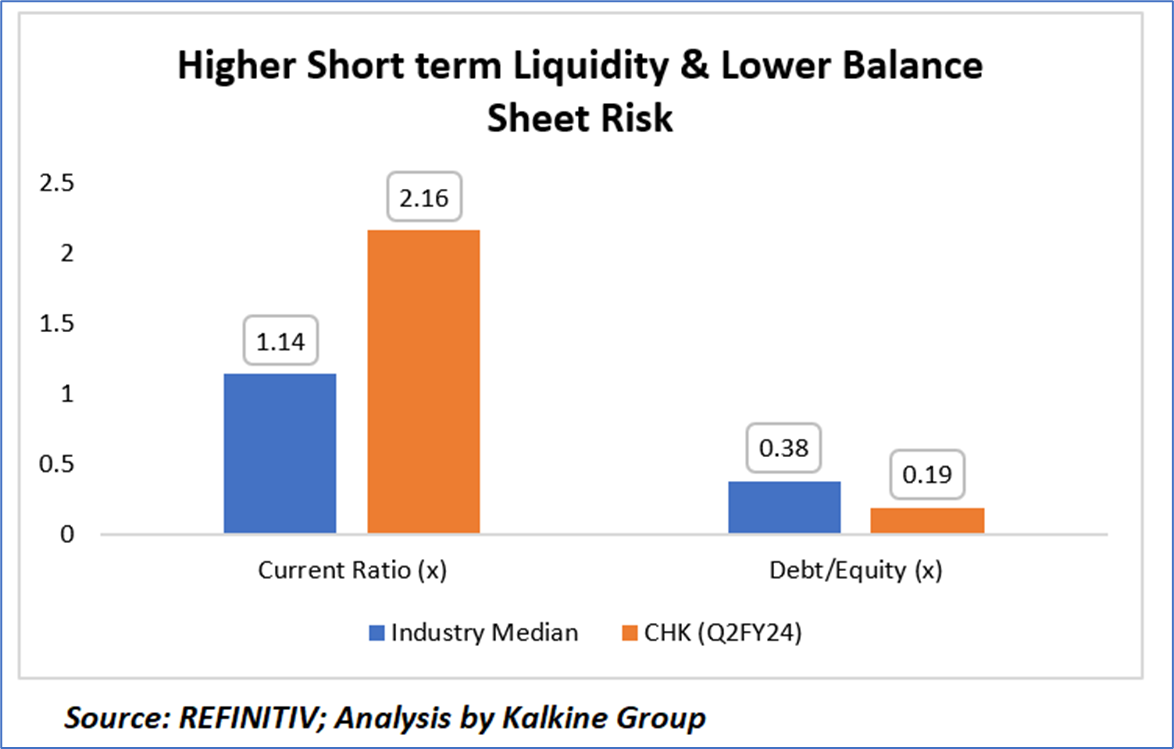
1.4 Key Metrics
Chesapeake Energy's (CHK) financial health for the second quarter of fiscal year 2024 compared to the industry median, notable metrics reveal a robust position. The current ratio for CHK stands at 2.16, significantly exceeding the industry median of 1.14, indicating a strong liquidity position and the company's ability to meet its short-term obligations effectively. Additionally, CHK's debt-to-equity ratio is 0.19, well below the industry median of 0.38. This lower leverage ratio suggests that CHK maintains a conservative capital structure, which may enhance financial stability and reduce risk exposure. Overall, these figures demonstrate Chesapeake's solid financial footing relative to its peers.
Section 2: Chesapeake Energy Corporation (“Buy” at the current market price of USD 72.23, as of August 23, 2024)
2.1 Company Details
2.2 Technical Guidance and Stock Recommendation
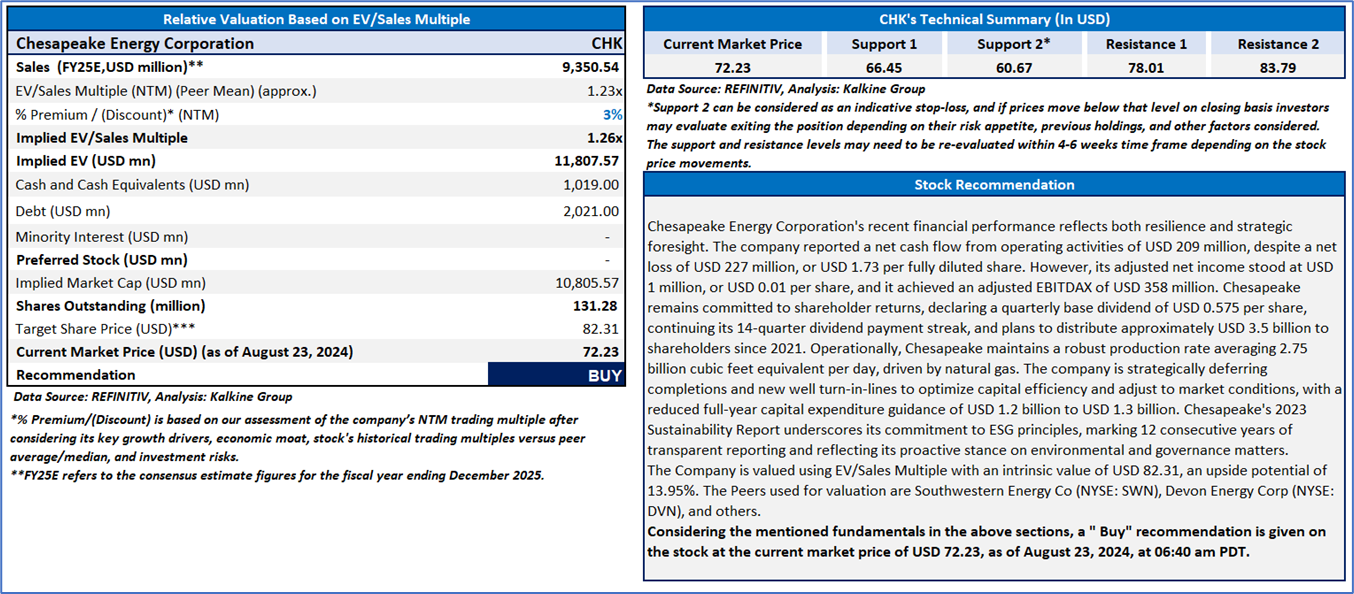
Markets are trading in a highly volatile zone currently due to certain macroeconomic issues and geopolitical tensions prevailing. Therefore, it is prudent to follow a cautious approach while investing.
Note 1: Past performance is not a reliable indicator of future performance.
Note 2: The reference date for all price data, currency, technical indicators, support, and resistance levels is August 23, 2024. The reference data in this report has been partly sourced from REFINITIV.
Note 3: Investment decisions should be made depending on an individual's appetite for upside potential, risks, holding duration, and any previous holdings. An 'Exit' from the stock can be considered if the Target Price mentioned as per the Valuation and or the technical levels provided has been achieved and is subject to the factors discussed above.
Note 4: The report publishing date is as per the Pacific Time Zone.
Technical Indicators Defined: -
Support: A level at which the stock prices tend to find support if they are falling, and a downtrend may take a pause backed by demand or buying interest. Support 1 refers to the nearby support level for the stock and if the price breaches the level, then Support 2 may act as the crucial support level for the stock.
Resistance: A level at which the stocks prices tend to find resistance when they are rising, and an uptrend may take a pause due to profit booking or selling interest. Resistance 1 refers to the nearby resistance level for the stock and if the price surpasses the level, then Resistance 2 may act as the crucial resistance level for the stock.
Stop-loss: It is a level to protect against further losses in case of unfavorable movement in the stock prices.
Kalkine Equities LLC, with Delaware File Number 4697384, Foreign Qualification Registration in California File Number 202109211078, and Texas File Number 805521396, is authorized to provide general advice only. The information on https://kalkine.com/ does not take into account any of your investment objectives, financial situation or needs. You should consider the appropriateness of advice taking into account your own objectives, financial situation and needs and seek independent financial advice before making any financial decisions. The link to our Terms and Conditions and Privacy Policy has been provided for your reference. On the date of publishing the reports (mentioned on the website), employees and/or associates of Kalkine do not hold positions in any of the stocks covered on the website. These stocks can change any time and readers of the reports should not consider these stocks as advice or recommendations later.
Copyright © 2024 Krish Capital Pty Ltd. All rights reserved.
 US
US  AU
AU UK
UK CA
CA NZ
NZ Please wait processing your request...