Section 1: Company Overview and Fundamentals
1.1 Company Overview:
HomeStreet, Inc. (NASDAQ: HMST) is a diversified financial services company. The Company is principally engaged in commercial banking, mortgage banking and consumer/retail banking activities serving customers primarily in the Western United States. It operates through its subsidiaries, which include HomeStreet Bank (the Bank), HomeStreet Statutory Trusts and HomeStreet Capital Corporation.
Kalkine’s Dividend Income Report covers the Company Overview, Key positives & negatives, Investment summary, Key investment metrics, Top 10 shareholding, Business updates and insights into company recent financial results, Key Risks & Outlook, Price performance and technical summary, Target Price, and Recommendation on the stock.
Stock Performance:

1.2 The Key Positives, Negatives, and Investment summary


1.3 Top 10 shareholders:
The top 10 shareholders together form ~49.67% of the total shareholding, signifying diverse shareholding. BlackRock Institutional Trust Company, N.A., and Dimensional Fund Advisors, L.P. are the biggest shareholders, holding the maximum stake in the company at ~14.01% and ~8.21%, respectively.

1.5 Consistent dividend payments with impressive dividend yield:
In recent years, HomeStreet Inc. has maintained a consistent dividend payment track record, regularly distributing dividends to its shareholders. Dividends are typically paid on a quarterly basis. HomeStreet, Inc. has announced that its Board of Directors has authorized a quarterly dividend of USD 0.10 per share. The dividend will be distributed to shareholders on May 24, 2023, with a record date of May 10, 2023. This decision reflects the Company's commitment to providing returns to its shareholders and signifies the confidence of the Board in the Company's financial position and prospects. As per the latest dividend amount, the dividend yield for the company is impressive 5.88%.

Section 2: Business Updates and Financial Highlights
2.1 Recent Updates:
The below picture gives an overview of the recent updates:

2.2 Insights of Q1FY23:

Section 3: Key Risks and Outlook:


Section 4: Stock Recommendation Summary:
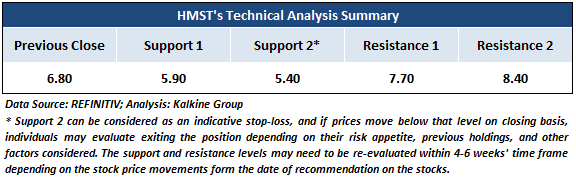
4.1 Price Performance and Technical Summary:
Stock Performance:

4.2 Fundamental Valuation
Valuation Methodology: Price/Book Value Per Share Multiple Based Relative Valuation


Markets are trading in a highly volatile zone currently due to certain macroeconomic issues and geopolitical tensions prevailing. Therefore, it is prudent to follow a cautious approach while investing.
Note 1: Past performance is not a reliable indicator of future performance.
Note 2: The reference date for all price data, currency, technical indicators, support, and resistance levels is June 13, 2023. The reference data in this report has been partly sourced from REFINITIV.
Note 3: Investment decisions should be made depending on an individual's appetite for upside potential, risks, holding duration, and any previous holdings. An 'Exit' from the stock can be considered if the Target Price mentioned as per the Valuation and or the technical levels provided has been achieved and is subject to the factors discussed above.
Note 4: The report publishing date is as per the Pacific Time Zone.
Technical Indicators Defined: -
Support: A level at which the stock prices tend to find support if they are falling, and a downtrend may take a pause backed by demand or buying interest. Support 1 refers to the nearby support level for the stock and if the price breaches the level, then Support 2 may act as the crucial support level for the stock.
Resistance: A level at which the stock prices tend to find resistance when they are rising, and an uptrend may take a pause due to profit booking or selling interest. Resistance 1 refers to the nearby resistance level for the stock and if the price surpasses the level, then Resistance 2 may act as the crucial resistance level for the stock.
Stop-loss: It is a level to protect against further losses in case of unfavorable movement in the stock prices.
Past performance is not a reliable indicator of future performance.
 Please wait processing your request...