
This report is an updated version of the report published on 17 January 2025 at 07:49 AM GMT.
Section 1: Company Overview, Low Carbon Emission Initiatives and Fundamentals
Section 1.1: Company Overview: Hollywood Bowl Group PLC (LSE: BOWL) is an FTSE 250 index listed bowling entertainment operator in the United Kingdom. The Company is engaged in the operation of ten-pin bowling centres, as well as the development of new centres and other associated activities. Kalkine’s Low Carbon Research Report covers the Investment Highlights, Low Carbon Emission Initiatives, Key Financial Metrics, Risks, and Technical Analysis along with the Valuation, Target Price, and Recommendation on the stock.
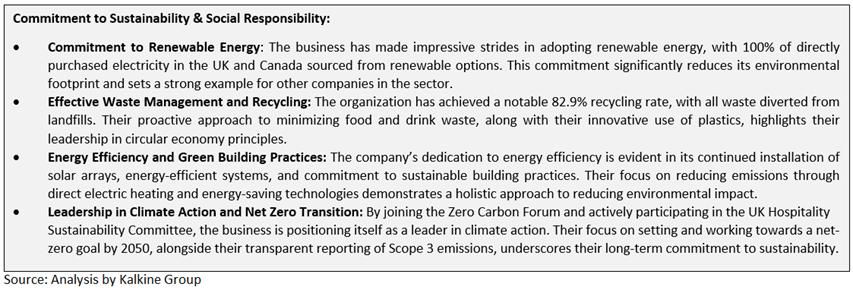
Section 1.2: Why Low Carbon Emission Matters?
The shift toward a low-carbon economy is one of the most significant challenges of current time, spurred by the urgent need to combat climate change and reduce the environmental impact of corporate activities. This report covers LSE-listed low-carbon emission company Hollywood Bowl Group PLC (LSE: BOWL), that is committed to sustainability and responsible environmental practices.
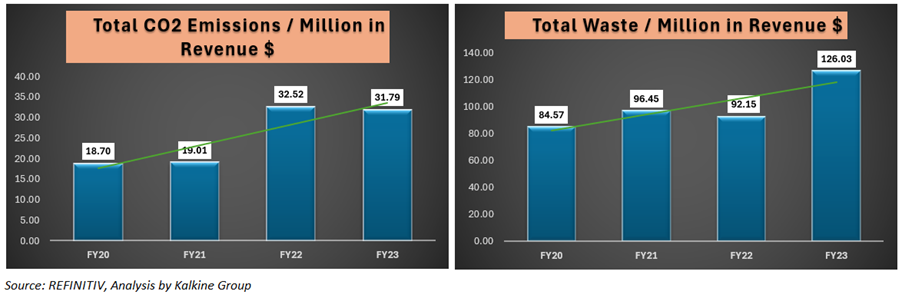
Carbon and Waste Management - Key Metrics
BOWL’s sustained environmental efforts have translated to improved CO2 emission, and waste management metrics since FY20, aligning with its net zero emissions goal.
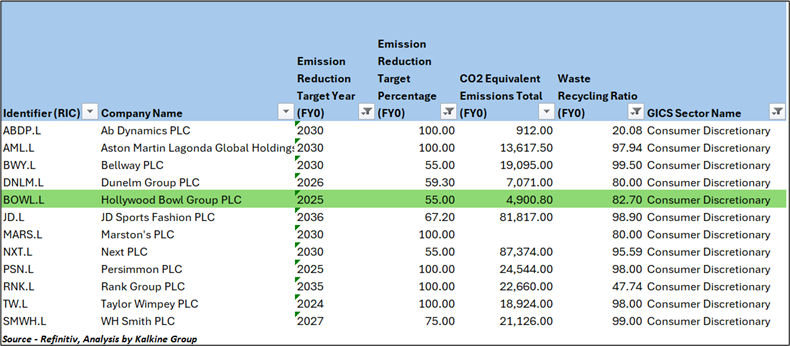
Peer Comparison: Carbon Emission Metrics
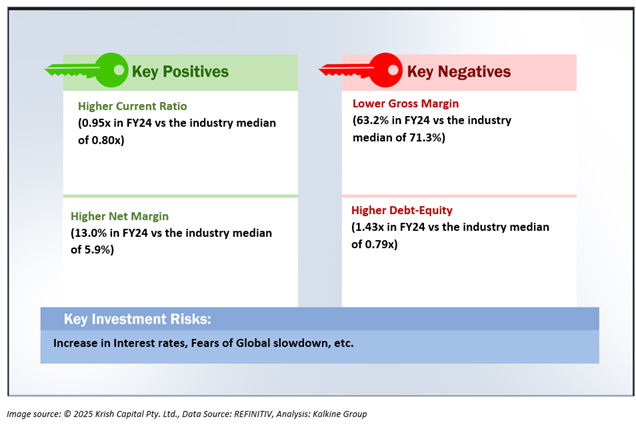
1.3 The Key Positives, Negatives, Investment Highlights, and Risks
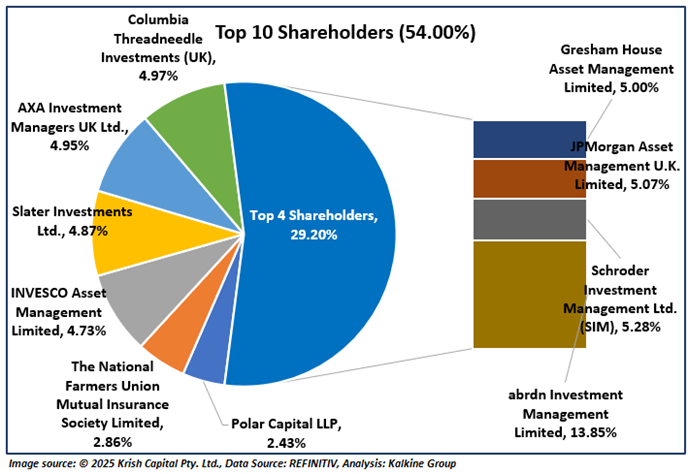
1.4 Top 10 Shareholders:
The top 10 shareholders together form ~54.00% of the total shareholding. abrdn Investment Management Limited and Schroder Investment Management Ltd. (SIM), hold maximum stakes in the company at ~13.85% and ~5.28%, respectively.
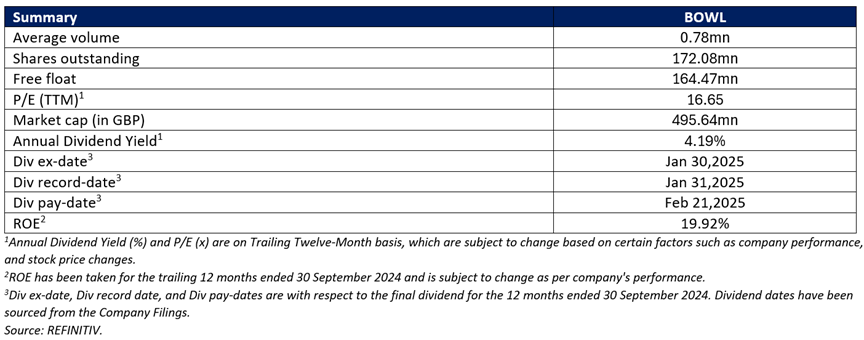
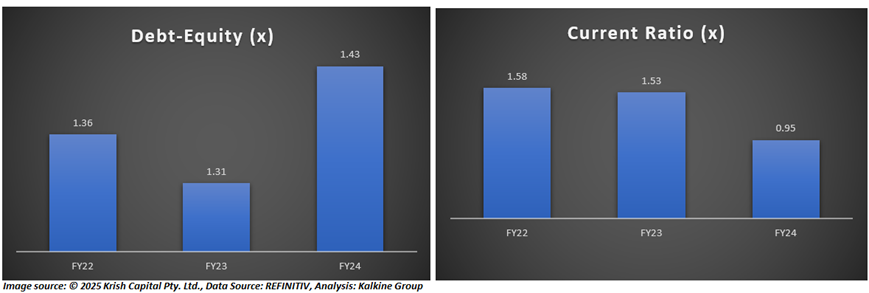
1.5 Key Metrics:
Section 2: Financial and Operational Highlights
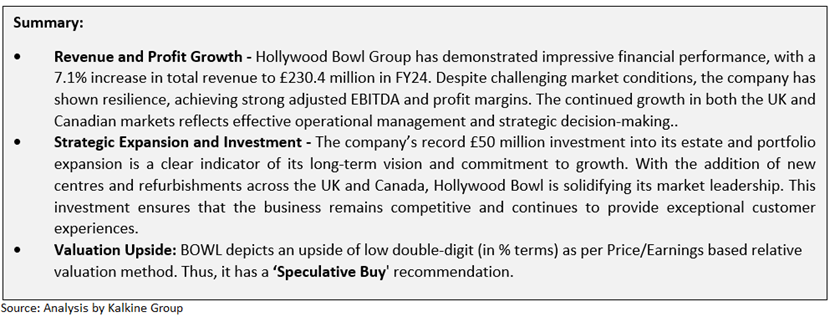
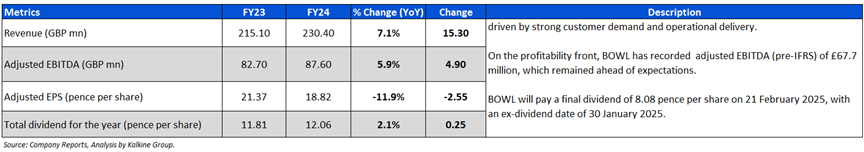
2.1 FY24 Results Highlights
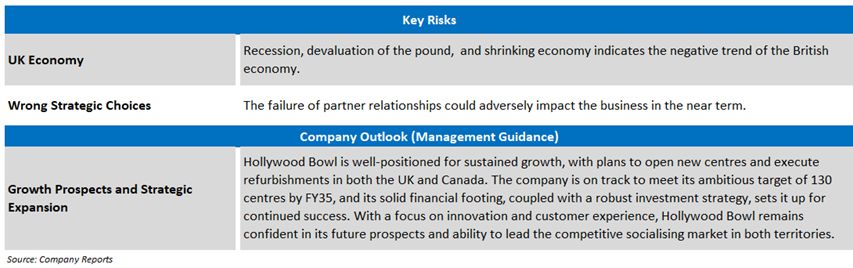
Section 3: Key Risks and Outlook:
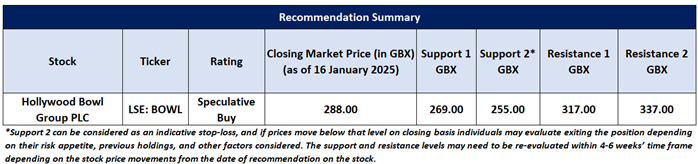
Section 4: Stock Recommendation Summary
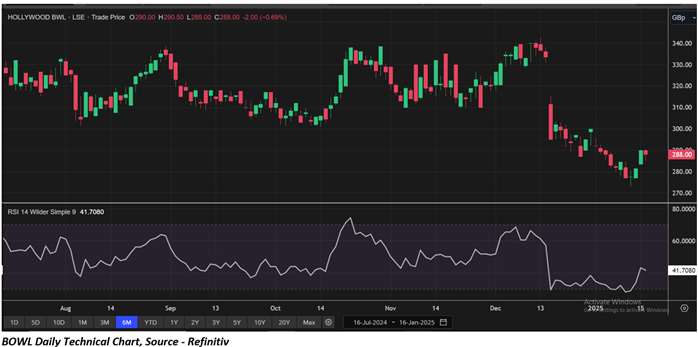
4.1 Price Performance and Technical Summary
The stock price has decreased by ~2.54% in the last one month, whereas over the last six months, it has been corrected by ~10.30%. The stock has a 52-week low and 52-week high of GBX 272.29 and GBX 355.00, respectively, and is currently trading below the mid points of its 52-week low and 52-week high.
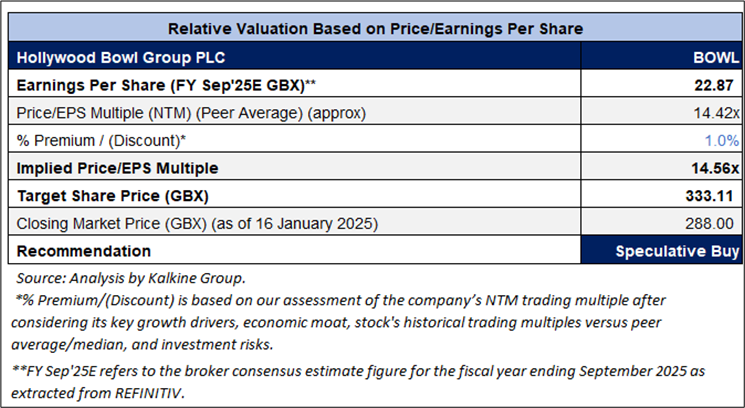
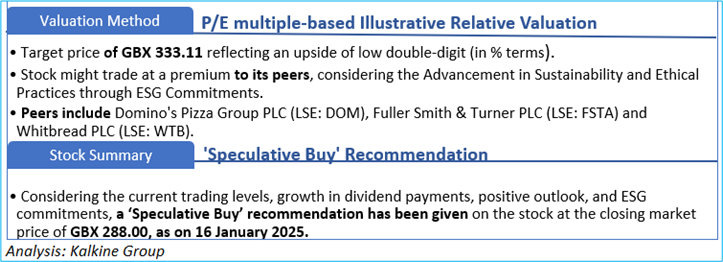
4.2 Fundamental Valuation
Valuation Methodology: P/E Multiple Based Relative Valuation (Illustrative)
Markets are trading in a highly volatile zone currently due to certain macro-economic issues and geopolitical tensions prevailing. Therefore, it is prudent to follow a cautious approach while investing.
Note 1: Past performance is not a reliable indicator of future performance.
Note 2: The reference data for all price data, currency, technical indicators, support, and resistance levels is 16 January 2025. The reference data in this report has been partly sourced from REFINITIV.
Note 3: Investment decisions should be made depending on an individual's appetite for upside potential, risks, holding duration, and any previous holdings. An 'Exit' from the stock can be considered if the Target Price mentioned as per the Valuation and or the technical levels provided has been achieved and is subject to the factors discussed above.
Note 4: Target Price refers to a price level that the stock is expected to reach as per the relative valuation method and/or technical analysis taking into consideration both short-term and long-term scenarios.
Note 5: Kalkine reports are prepared based on the stock prices captured either from the London Stock Exchange (LSE) and or REFINITIV. Typically, both sources (LSE and or REFINITIV) may reflect stock prices with a delay which could be a lag of 15-20 minutes. There can be no assurance that future results or events will be consistent with the information provided in the report. The information is subject to change without any prior notice.
Note 6: Dividend Yield may vary as per the stock price movement.
Technical Indicators Defined: -
Support: A level at which the stock prices tend to find support if they are falling, and a downtrend may take a pause backed by demand or buying interest. Support 1 refers to the nearby support level for the stock and if the price breaches the level, then Support 2 may act as the crucial support level for the stock.
Resistance: A level at which the stock prices tend to find resistance when they are rising, and an uptrend may take a pause due to profit booking or selling interest. Resistance 1 refers to the nearby resistance level for the stock and if the price surpasses the level, then Resistance 2 may act as the crucial resistance level for the stock.
Stop-loss: It is a level to protect further losses in case of unfavourable movement in the stock prices.
Kalkine Equities LLC, with Delaware File Number 4697384, Foreign Qualification Registration in California File Number 202109211078, and Texas File Number 805521396, is authorized to provide general advice only. The information on https://kalkine.com/ does not take into account any of your investment objectives, financial situation or needs. You should consider the appropriateness of advice taking into account your own objectives, financial situation and needs and seek independent financial advice before making any financial decisions. The link to our Terms and Conditions and Privacy Policy has been provided for your reference. On the date of publishing the reports (mentioned on the website), employees and/or associates of Kalkine do not hold positions in any of the stocks covered on the website. These stocks can change any time and readers of the reports should not consider these stocks as advice or recommendations later.
Past performance is not a reliable indicator of future performance.
 Please wait processing your request...