Section 1: Company Fundamentals
1.1 Company Overview and Performance summary
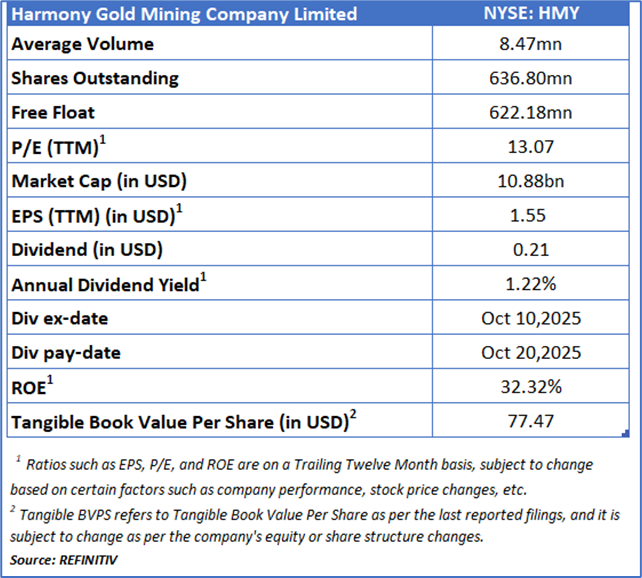
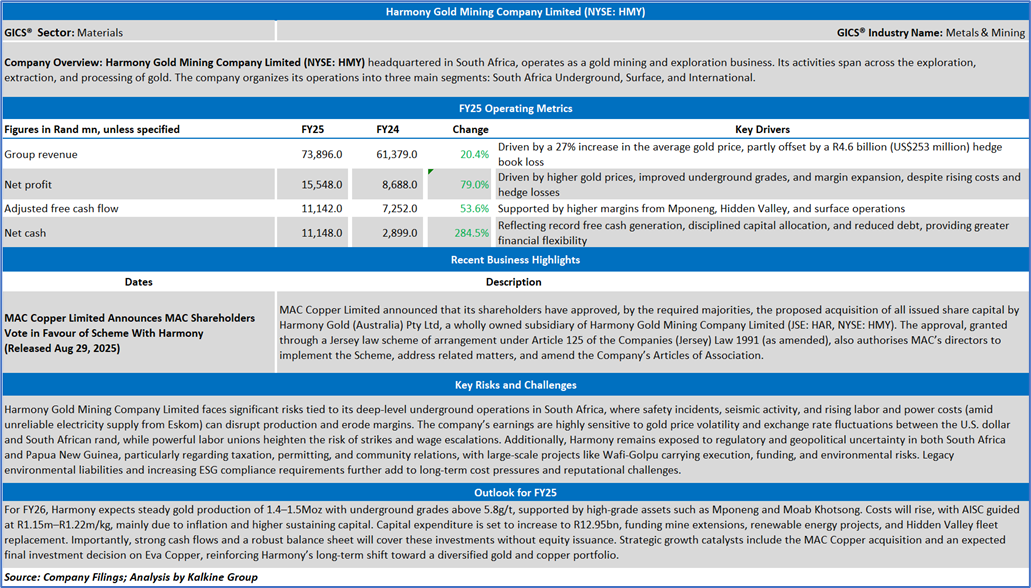
Company Overview:
Harmony Gold Mining Company Limited (NYSE: HMY) headquartered in South Africa, operates as a gold mining and exploration business. Its activities span across the exploration, extraction, and processing of gold. The company organizes its operations into three main segments: South Africa Underground, Surface, and International.
This US Inflation Report covers the Company Overview & Price performance, Summary table, Key positives & negatives, Key metrics, Company details, technical guidance & Stock recommendation, and Price chart.
Price Performance:
1.2 Summary Table
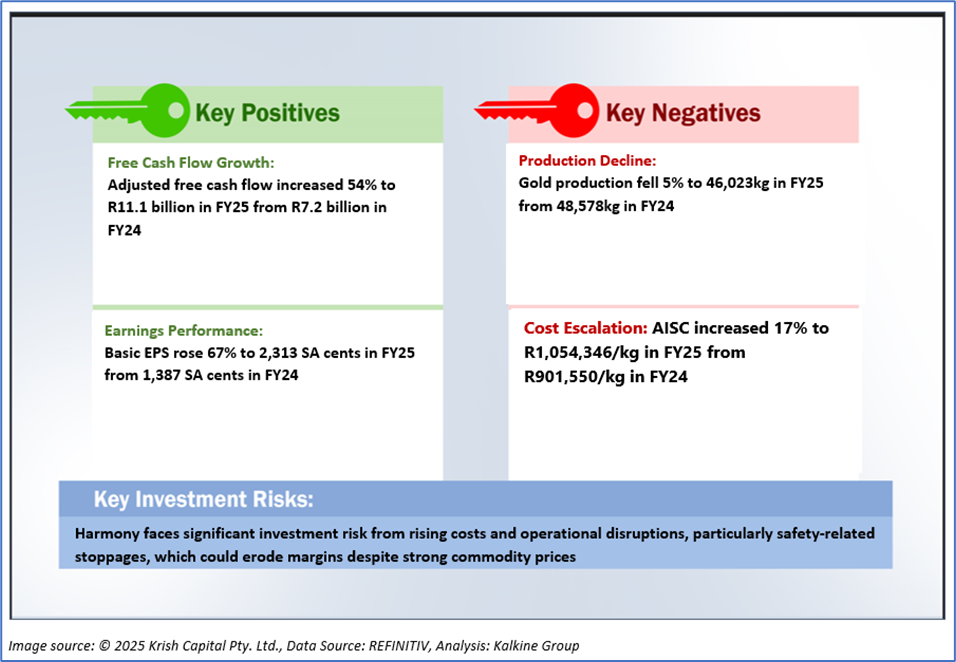
1.3 The Key Positives & Negatives
1.4 Key Metrics
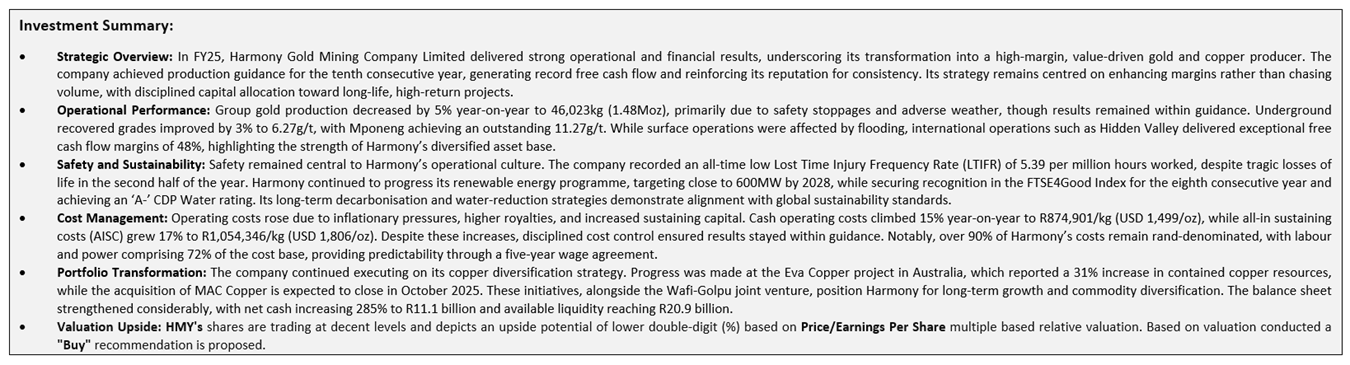
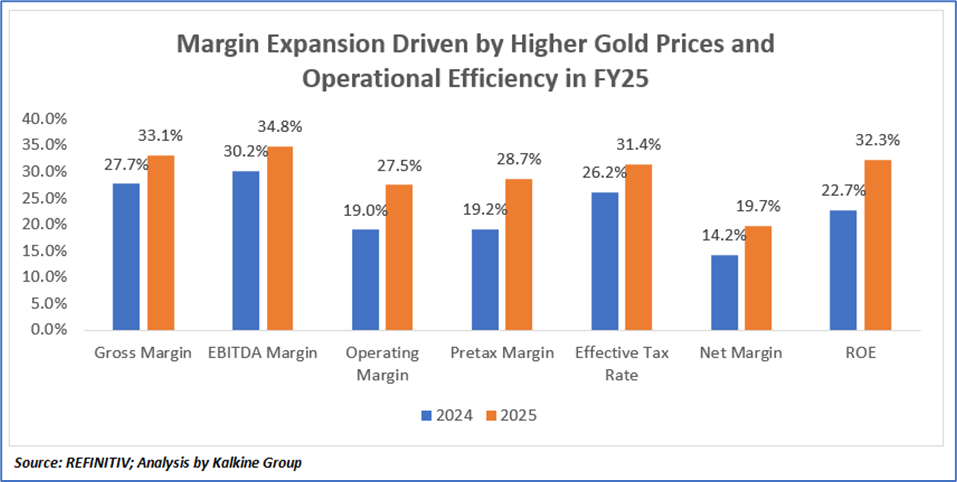
In FY25, Harmony Gold Mining Company Limited reported a notable uplift across its financial performance indicators, reflecting the combined effect of favourable market conditions and disciplined execution. Revenue and profitability benefited primarily from a 27% increase in the average gold price received and improved underground recovered grades, particularly at Mponeng, which achieved a grade of 11.27g/t. These factors drove an expansion in gross, EBITDA, operating, and pretax margins, demonstrating the resilience and efficiency of the company’s operating model. Strong contributions from high-margin operations such as Mponeng, Hidden Valley, and surface assets further supported margin growth, even as inflationary pressures raised labour, electricity, and royalty costs. Net margin improved materially as earnings rose, translating into a significant jump in return on equity, which reflected Harmony’s strengthened ability to generate shareholder value from its capital base. However, the effective tax rate increased due to higher taxable income, particularly from South African underground operations, and realised hedge book losses tempered the full benefit of higher gold prices. Overall, Harmony’s FY25 performance highlights the success of its value-over-volume strategy, with a stronger balance sheet, record free cash flows, and enhanced returns positioning the company favourably for its ongoing copper diversification and growth initiatives.
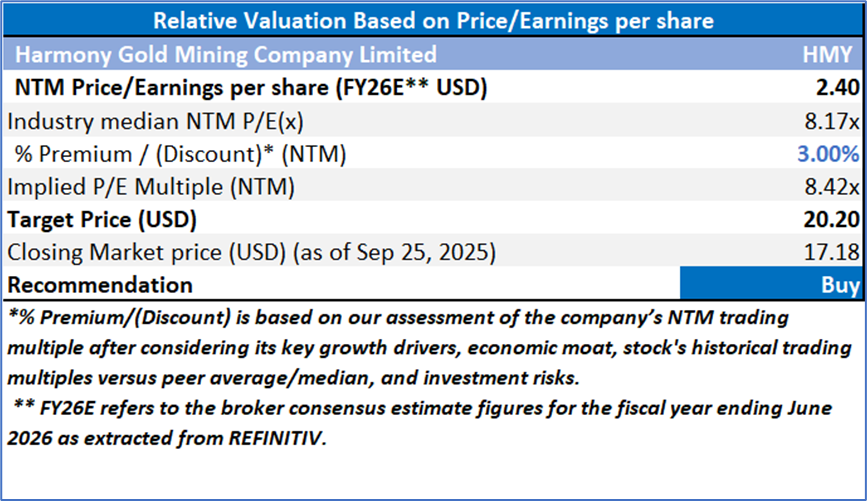
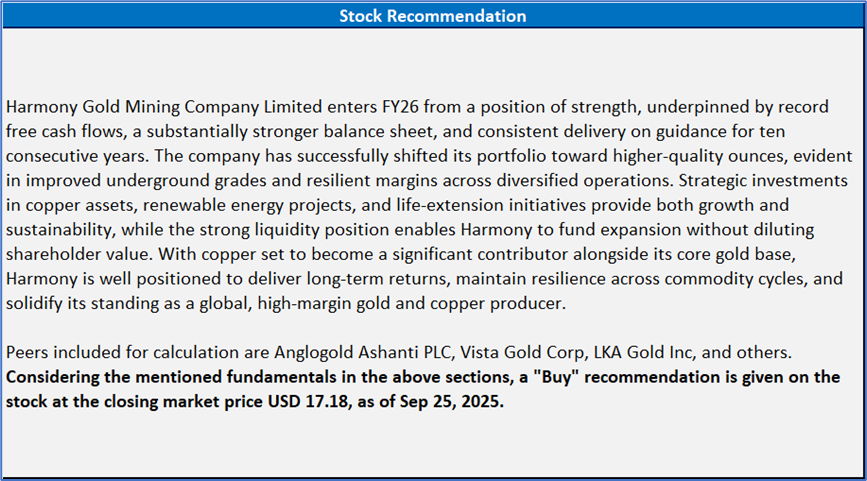
Section 2: Harmony Gold Mining Company Limited (NYSE: HMY) (“Buy” at the closing market price of USD 17.18, as of Sep 25,2025)
2.1 Company Details
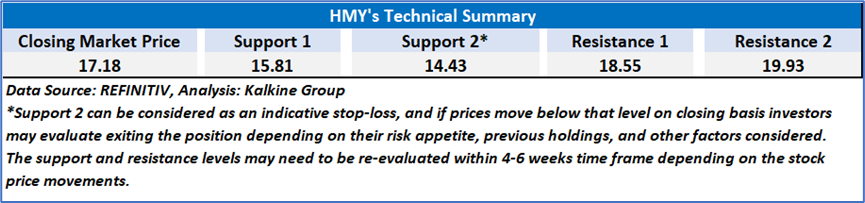
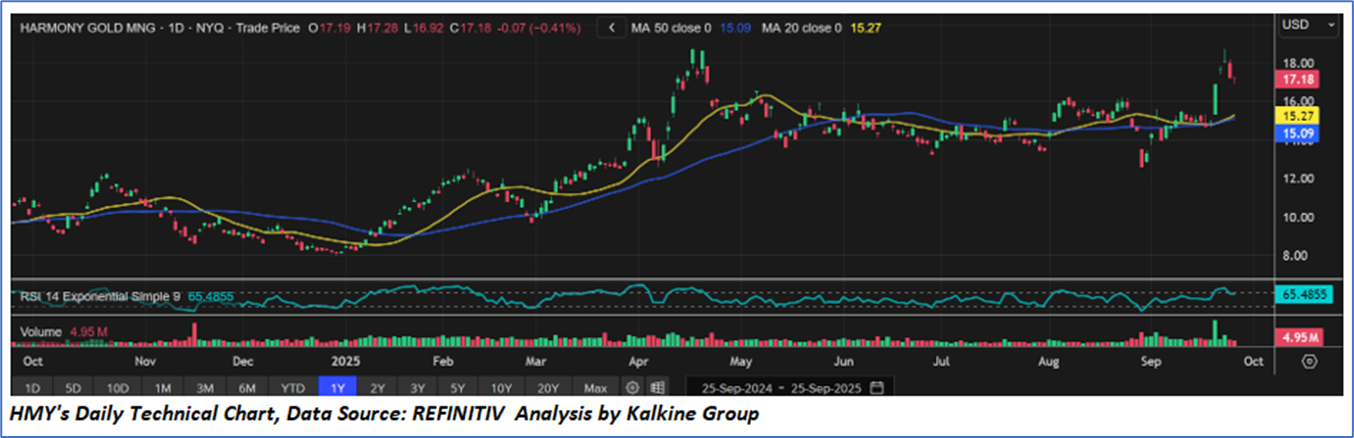
2.2 Technical Guidance and Stock Recommendation
Markets are trading in a highly volatile zone currently due to certain macroeconomic issues and geopolitical tensions prevailing. Therefore, it is prudent to follow a cautious approach while investing.
Note 1: Past performance is not a reliable indicator of future performance.
Note 2: The reference date for all price data, currency, technical indicators, support, and resistance levels is Sep 25, 2025. The reference data in this report has been partly sourced from REFINITIV.
Note 3: Investment decisions should be made depending on an individual's appetite for upside potential, risks, holding duration, and any previous holdings. An 'Exit' from the stock can be considered if the Target Price mentioned as per the Valuation and or the technical levels provided has been achieved and is subject to the factors discussed above.
Note 4: The report publishing date is as per the Pacific Time Zone.
Technical Indicators Defined: -
Support: A level at which the stock prices tend to find support if they are falling, and a downtrend may take a pause backed by demand or buying interest. Support 1 refers to the nearby support level for the stock and if the price breaches the level, then Support 2 may act as the crucial support level for the stock.
Resistance: A level at which the stocks prices tend to find resistance when they are rising, and an uptrend may take a pause due to profit booking or selling interest. Resistance 1 refers to the nearby resistance level for the stock and if the price surpasses the level, then Resistance 2 may act as the crucial resistance level for the stock.
Stop-loss: It is a level to protect against further losses in case of unfavorable movement in the stock prices.
Kalkine Equities LLC, with Delaware File Number 4697384, Foreign Qualification Registration in California File Number 202109211078, and Texas File Number 805521396, is authorized to provide general advice only. The information on https://kalkine.com/ does not take into account any of your investment objectives, financial situation or needs. You should consider the appropriateness of advice taking into account your own objectives, financial situation and needs and seek independent financial advice before making any financial decisions. The link to our Terms and Conditions and Privacy Policy has been provided for your reference. On the date of publishing the reports (mentioned on the website), employees and/or associates of Kalkine do not hold positions in any of the stocks covered on the website. These stocks can change any time and readers of the reports should not consider these stocks as advice or recommendations later.
Past performance is not a reliable indicator of future performance.
 Please wait processing your request...