Section 1: Company Fundamentals
1.1 Company Overview and Performance summary
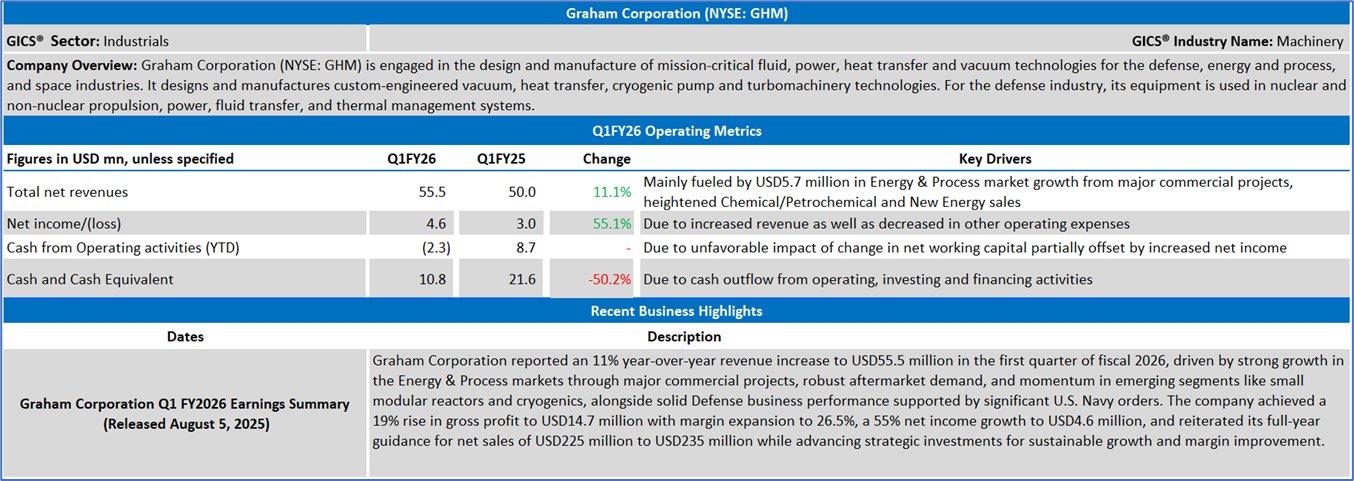
Company Overview:
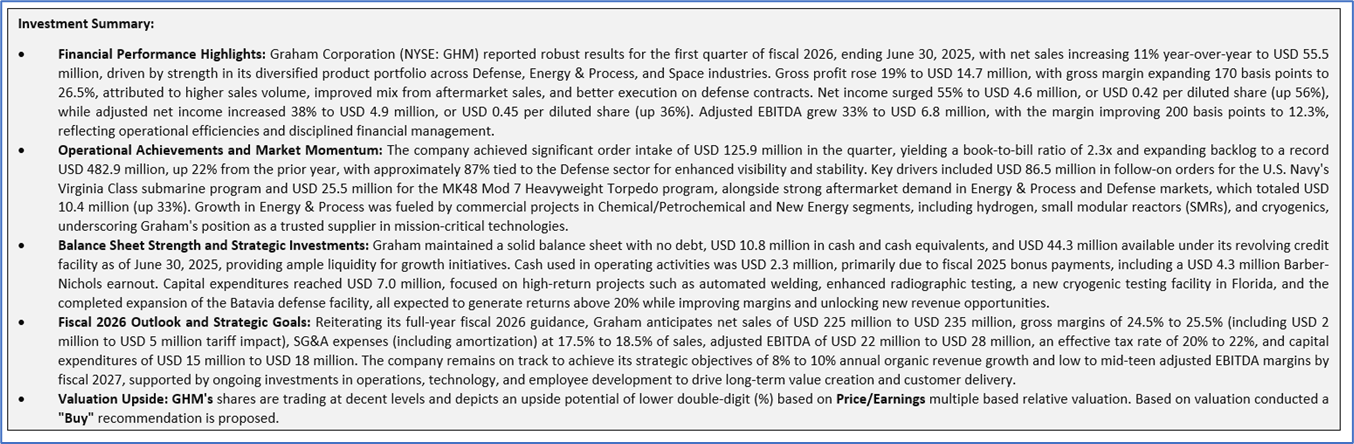
Graham Corporation (NYSE: GHM) is engaged in the design and manufacture of mission-critical fluid, power, heat transfer and vacuum technologies for the defense, energy and process, and space industries. It designs and manufactures custom-engineered vacuum, heat transfer, cryogenic pump and turbomachinery technologies. For the defense industry, its equipment is used in nuclear and non-nuclear propulsion, power, fluid transfer, and thermal management systems.
This US Inflation Report covers the Company Overview & Price performance, Summary table, Key positives & negatives, Key metrics, Company details, technical guidance & Stock recommendation, and Price chart.
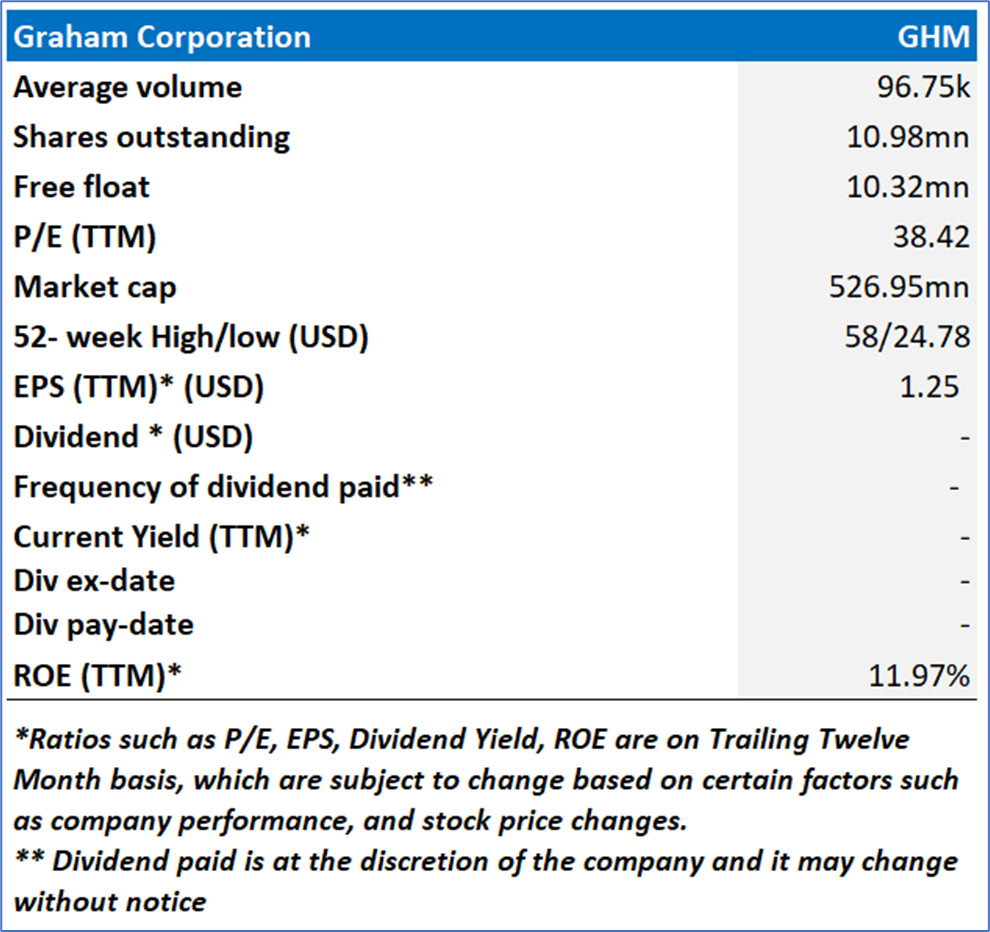
1.2 Summary Table
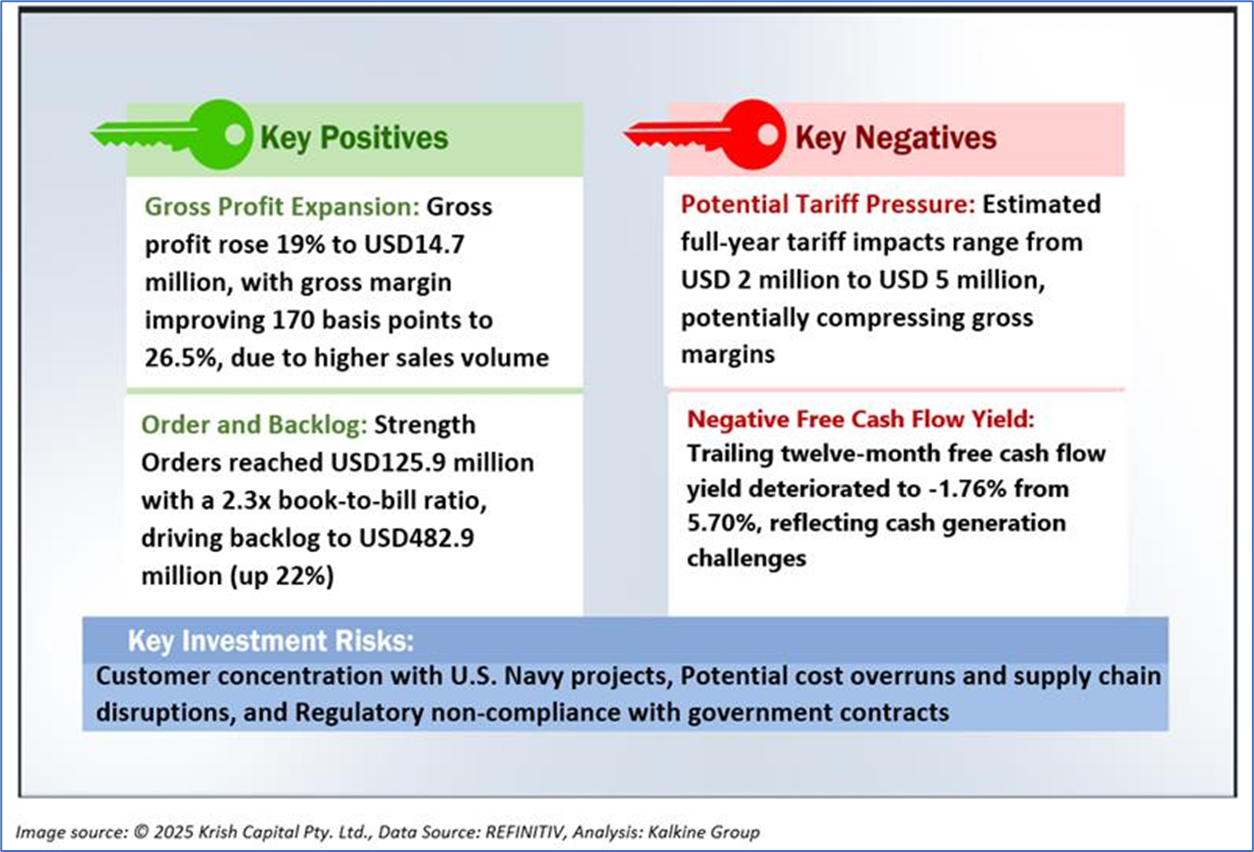
1.3 The Key Positives & Negatives
1.4 Key Metrics
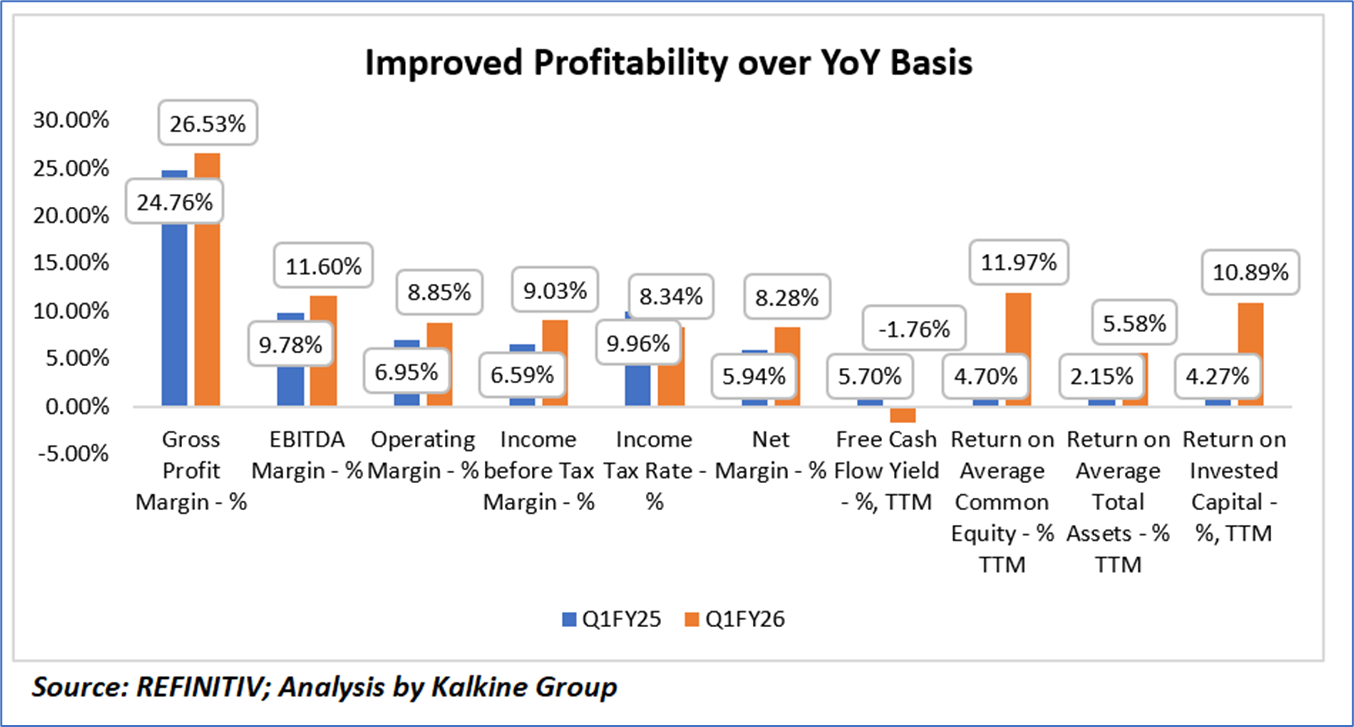
Graham Corporation (NYSE: GHM) exhibited marked year-over-year profitability enhancements in the first quarter of fiscal 2026 compared to fiscal 2025, as gross profit margin expanded from 24.76% to 26.53% driven by improved sales mix and operational efficiencies, while EBITDA margin rose from 9.78% to 11.60% and operating margin increased from 6.95% to 8.85%, reflecting better cost leverage and execution on high-margin projects; pre-tax income margin advanced from 6.59% to 9.03%, bolstered by a modest decline in the effective income tax rate from 9.96% to 8.34%, culminating in a net margin uplift from 5.94% to 8.28%. However, trailing twelve-month (TTM) free cash flow deteriorated from 5.70% to -1.76%, potentially due to elevated capital expenditures and working capital demands amid growth initiatives. On a TTM basis, returns demonstrated robust capital efficiency gains, with return on average common equity surging from 4.70% to 11.97%, return on average total assets improving from 2.15% to 5.58%, and return on invested capital climbing from 4.27% to 10.89%, underscoring the company's strengthened asset utilization and shareholder value creation in its defense, energy, and space sectors.
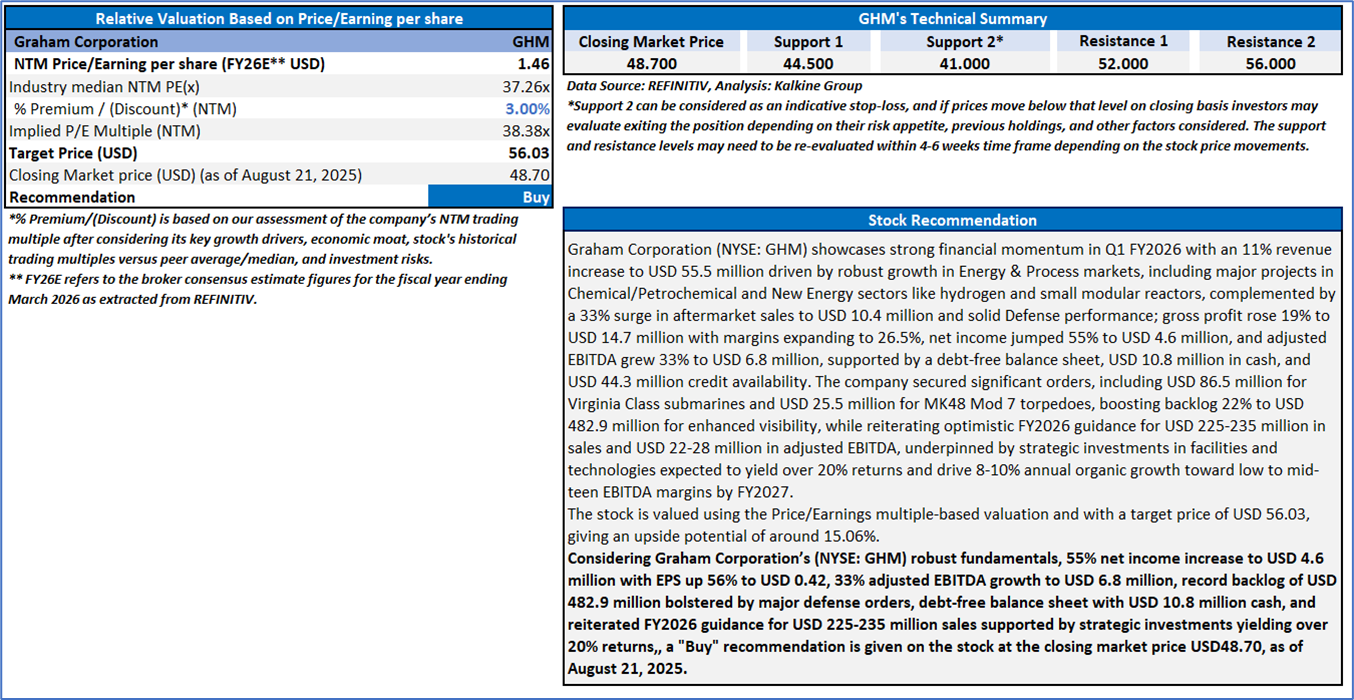
Section 2: Graham Corporation (NYSE: GHM) (“Buy” at the closing price of USD 48.70, as of August 21, 2025)
2.1 Company Details
2.2 Technical Guidance and Stock Recommendation
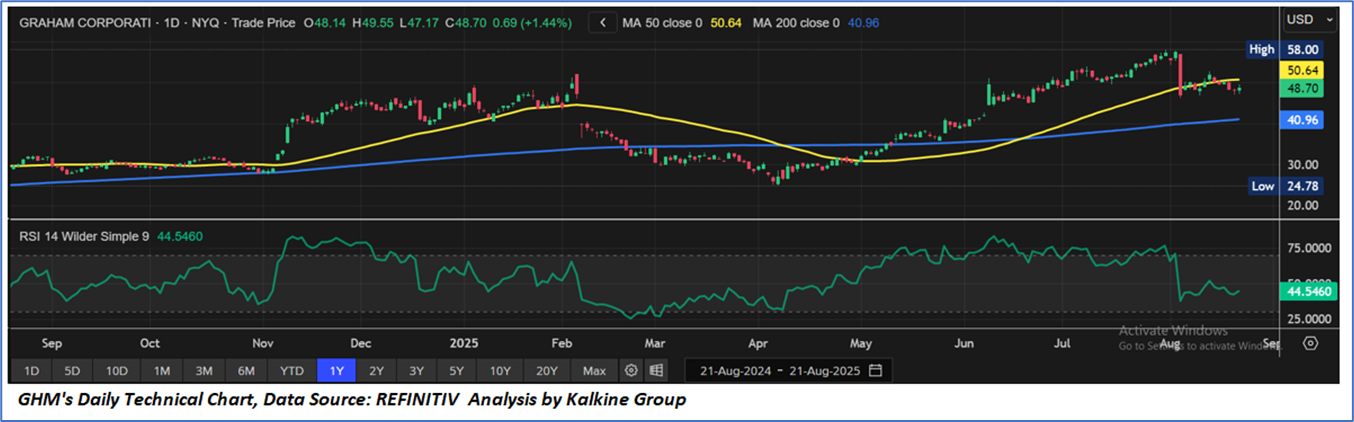
Markets are trading in a highly volatile zone currently due to certain macroeconomic issues and geopolitical tensions prevailing. Therefore, it is prudent to follow a cautious approach while investing.
Note 1: Past performance is not a reliable indicator of future performance.
Note 2: The reference date for all price data, currency, technical indicators, support, and resistance levels is August 21, 2025. The reference data in this report has been partly sourced from REFINITIV.
Note 3: Investment decisions should be made depending on an individual's appetite for upside potential, risks, holding duration, and any previous holdings. An 'Exit' from the stock market can be considered if the Target Price mentioned as per the Valuation and the technical levels provided have been achieved and is subject to the factors discussed above.
Note 4: The report publishing date is as per the Pacific Time Zone.
Technical Indicators Defined: -
Support: A level at which stock prices tend to find support if they fall, and a downtrend may take a pause backed by demand or buying interest. Support 1 refers to the nearby support level for the stock and if the price breaches the level, then Support 2 may act as the crucial support level for the stock.
Resistance: A level at which the stocks prices tend to find resistance when they are rising, and an uptrend may take a pause due to profit booking or selling interest. Resistance 1 refers to the nearby resistance level for the stock and if the price surpasses the level, then Resistance 2 may act as the crucial resistance level for the stock.
Stop-loss: It is a level to protect against further losses in case of unfavorable movement in the stock prices.
Kalkine Equities LLC, with Delaware File Number 4697384, Foreign Qualification Registration in California File Number 202109211078, and Texas File Number 805521396, is authorized to provide general advice only. The information on https://kalkine.com/ does not take into account any of your investment objectives, financial situation or needs. You should consider the appropriateness of advice taking into account your own objectives, financial situation and needs and seek independent financial advice before making any financial decisions. The link to our Terms and Conditions and Privacy Policy has been provided for your reference. On the date of publishing the reports (mentioned on the website), employees and/or associates of Kalkine do not hold positions in any of the stocks covered on the website. These stocks can change any time and readers of the reports should not consider these stocks as advice or recommendations later.
Past performance is not a reliable indicator of future performance.
 Please wait processing your request...