
Section 1: Company Overview and Fundamentals
1.1 Company Overview:
Endeavour Silver Corp. (NYSE: EXK) is a Canada-based precious metals mining company. The Company is engaged in silver mining in Mexico and related activities, including property acquisition, exploration, development, mineral extraction, processing, refining and reclamation. The Company operates two high-grade underground silver-gold mines in Mexico.
Kalkine’s Diversified Opportunities Report covers the Company Overview, Key positives & negatives, Investment summary, Key investment metrics, Top 10 shareholding, Business updates and insights into company recent financial results, Key Risks & Outlook, Price performance and technical summary, Target Price, and Recommendation on the stock.
Price Performance:

1.2 The Key Positives, Negatives, and Investment summary


1.3 Top 10 shareholders:
The top 10 shareholders together form ~23.34% of the total shareholding, signifying diverse shareholding. Van Eck Associates Corporation, and ETF Managers Group, LLC are the biggest shareholders, holding the maximum stake in the company at ~10.28% and ~2.85%, respectively.

1.4 Key Metrics:
Endeavour Silver Corp. (EXK) has demonstrated a consistent upward trajectory in its revenue and profitability metrics over the past five years, except for the year 2019. Notably, in 2019, the company experienced a decline in revenue and reported a negative gross profit. This downturn can be attributed to factors such as a substantial drop in silver prices by approximately 20%, a decrease in production volume by around 10%, and an increase in overall expenses. Over the specified period, EXK's revenue showcased a significant growth, advancing from USD 150.5 million in fiscal year 2018 to USD 210.2 million in fiscal year 2022. Similarly, the company's gross profit also exhibited remarkable expansion, ascending from USD 3.5 million in fiscal year 2018 to USD 51.5 million in fiscal year 2022. It is noteworthy that despite the temporary setback in 2019, EXK has managed to recover and achieve substantial financial improvements in subsequent years. The company's strategic efforts to enhance revenue and profitability have been evidenced by the remarkable growth observed in the latter years of the five-year period.
Furthermore, an analysis of EXK's financial health unveils a lower balance sheet risk, as evidenced by a comparatively lower debt/equity ratio in relation to the industry median. This suggests a prudent approach to financial leverage and risk management. Additionally, EXK's financial stability is reinforced by its higher short-term liquidity position, characterized by a higher current ratio when compared to the industry median. This indicates the company's ability to meet its short-term obligations and highlights a positive aspect of its financial management.

1.5 Underlying Commodities Analysis:
Silver declined to approximately USD 22.7 per ounce, reaching close to a one-month low, as traders adopted a cautious stance prior to the release of US inflation data and following a mixed employment report from the country. Despite a slowdown in the rate of job creation, there was an acceleration in wage growth, indicating the labor market's resilience. However, the market was bolstered by robust industrial demand and indications of constrained supply, mitigating the downward pressure. Moreover, the push to address carbon emissions hastened the advancement of solar panel technologies, which require increased conductivity, leading to substantial upgrades in silver demand projections. Notably, solar panel companies are anticipated to account for 14% of global silver consumption, a significant rise from the 5% reported in 2014. Simultaneously, the anticipated growth in output is projected to be more modest at 2%, raising concerns of a potential supply deficit.
Gold remained below USD 1,930 per ounce, encountering sustained downward pressure as investors braced themselves for pivotal US inflation data, which holds the potential to influence the course of interest rates. The forthcoming US consumer price index report is scheduled for Thursday, with the producer price index report slated for the subsequent day. The precious metal has faced downward pressure since mid-July due to signs of economic resilience in the US and expectations that the Federal Reserve will continue to maintain a restrictive monetary policy.

Section 2: Business Updates and Corporate Business Highlights
2.1 Recent Updates:
The below picture gives an overview of the recent updates:

2.2 Insights of Q2FY23:

Section 3: Key Risks & Outlook

Section 4: Stock Recommendation Summary:
4.1 Price Performance and Technical Summary:
Stock Performance:


4.2 Fundamental Valuation
Valuation Methodology: EV/Sales Multiple Based Relative Valuation
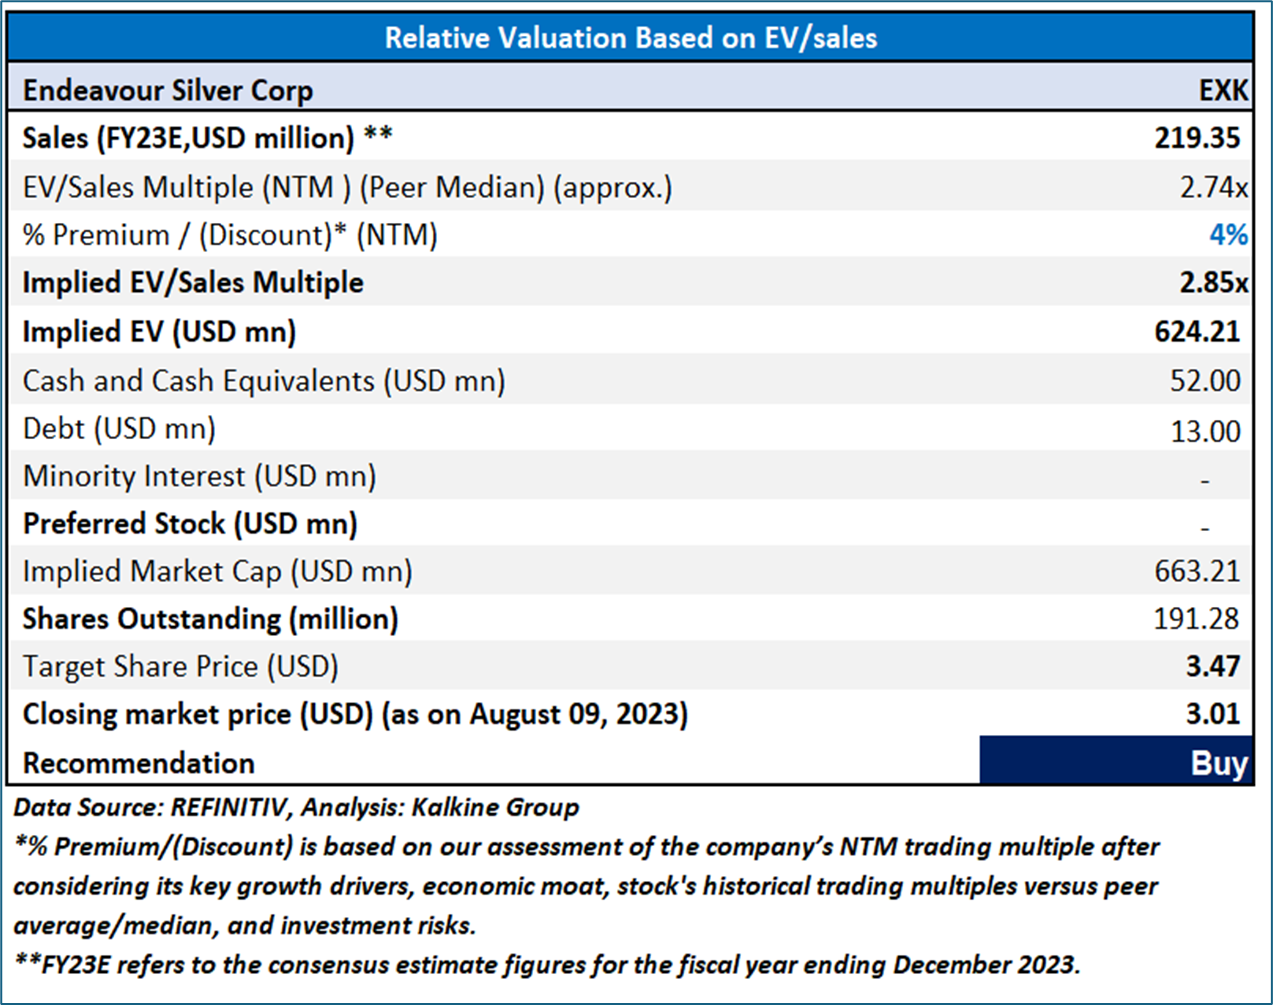

Markets are trading in a highly volatile zone currently due to certain macroeconomic issues and geopolitical tensions prevailing. Therefore, it is prudent to follow a cautious approach while investing.
Note 1: Past performance is not a reliable indicator of future performance.
Note 2: The reference date for all price data, currency, technical indicators, support, and resistance levels is August 09, 2023. The reference data in this report has been partly sourced from REFINITIV.
Note 3: Investment decisions should be made depending on an individual's appetite for upside potential, risks, holding duration, and any previous holdings. An 'Exit' from the stock can be considered if the Target Price mentioned as per the Valuation and or the technical levels provided has been achieved and is subject to the factors discussed above.
Note 4: The report publishing date is as per the Pacific Time Zone.
Technical Indicators Defined: -
Support: A level at which the stock prices tend to find support if they are falling, and a downtrend may take a pause backed by demand or buying interest. Support 1 refers to the nearby support level for the stock and if the price breaches the level, then Support 2 may act as the crucial support level for the stock.
Resistance: A level at which the stock prices tend to find resistance when they are rising, and an uptrend may take a pause due to profit booking or selling interest. Resistance 1 refers to the nearby resistance level for the stock and if the price surpasses the level, then Resistance 2 may act as the crucial resistance level for the stock.
Stop-loss: It is a level to protect against further losses in case of unfavorable movement in the stock prices.
Kalkine Equities LLC, with Delaware File Number 4697384, Foreign Qualification Registration in California File Number 202109211078, and Texas File Number 805521396, is authorized to provide general advice only. The information on https://kalkine.com/ does not take into account any of your investment objectives, financial situation or needs. You should consider the appropriateness of advice taking into account your own objectives, financial situation and needs and seek independent financial advice before making any financial decisions. The link to our Terms and Conditions and Privacy Policy has been provided for your reference. On the date of publishing the reports (mentioned on the website), employees and/or associates of Kalkine do not hold positions in any of the stocks covered on the website. These stocks can change any time and readers of the reports should not consider these stocks as advice or recommendations later.
Past performance is not a reliable indicator of future performance.
 Please wait processing your request...