
Section 1: Company Overview and Fundamentals
1.1 Company Overview:
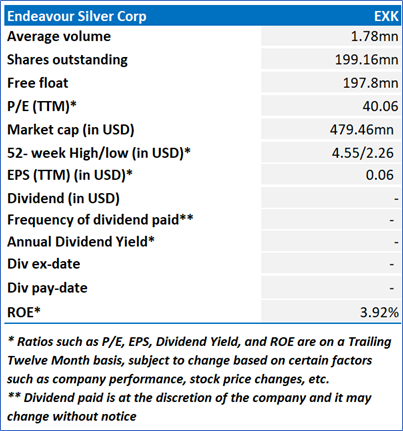
Endeavour Silver Corp. (NYSE: EXK) is a Canada-based precious metals mining company. The Company is engaged in silver mining in Mexico and related activities, including property acquisition, exploration, development, mineral extraction, processing, refining and reclamation. The Company operates two high-grade underground silver-gold mines in Mexico.
Kalkine’s Diversified Opportunities Report covers the Company Overview, Key positives & negatives, Investment summary, Key investment metrics, Top 10 shareholding, Business updates and insights into company recent financial results, Key Risks & Outlook, Price performance and technical summary, Target Price, and Recommendation on the stock.
Price Performance:
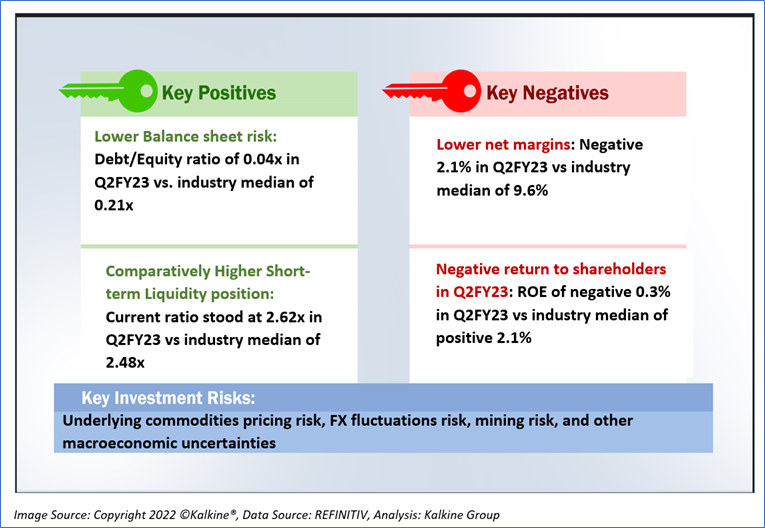
1.2 The Key Positives, Negatives, and Investment summary
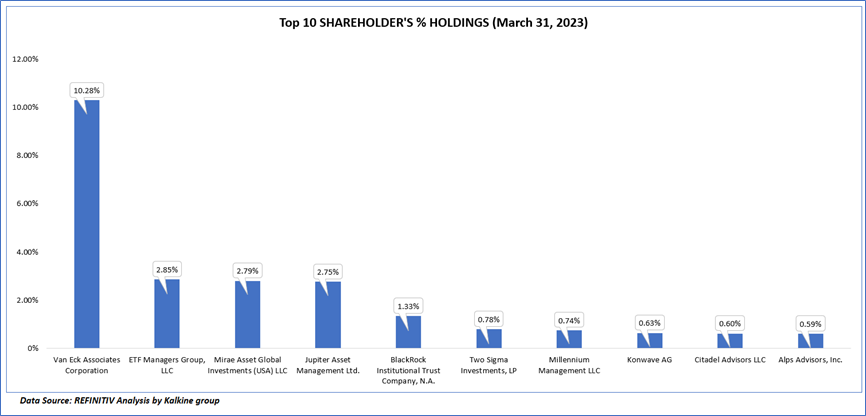
1.3 Top 10 shareholders:
The top 10 shareholders together form ~23.34% of the total shareholding, signifying diverse shareholding. Van Eck Associates Corporation, and ETF Managers Group, LLC are the biggest shareholders, holding the maximum stake in the company at ~10.28% and ~2.85%, respectively.
1.4 Key Metrics:
Endeavour Silver Corp. (EXK) has shown consistent revenue and profitability improvements over the past five years, with a temporary decline in 2019. Various factors contributed to this downturn, including a 20% drop in silver prices, a 10% decrease in production volume, and rising expenses. However, over this period, EXK's revenue grew significantly from USD 150.5 million in 2018 to USD 210.2 million in 2022. The company's gross profit also expanded from USD 3.5 million in 2018 to USD 51.5 million in 2022. Despite the setback in 2019, EXK rebounded successfully, highlighting the effectiveness of its later-year efforts to enhance financial performance.
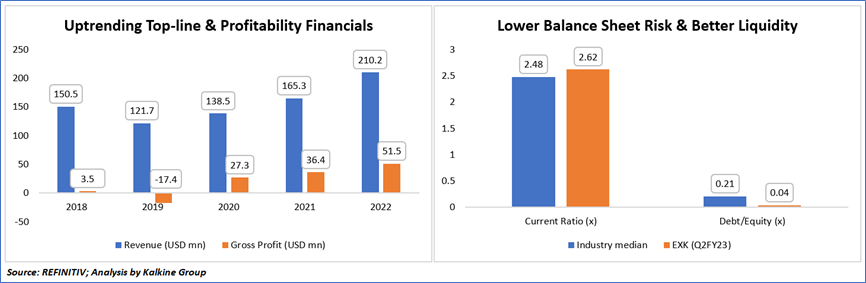
Furthermore, an assessment of EXK's financial stability reveals a lower balance sheet risk, evident in a lower debt/equity ratio compared to industry peers. This reflects a cautious approach to financial leverage and risk management. Additionally, EXK maintains a robust short-term liquidity position, with a higher current ratio compared to industry standards, indicating its ability to meet short-term obligations, and demonstrating strong financial management.
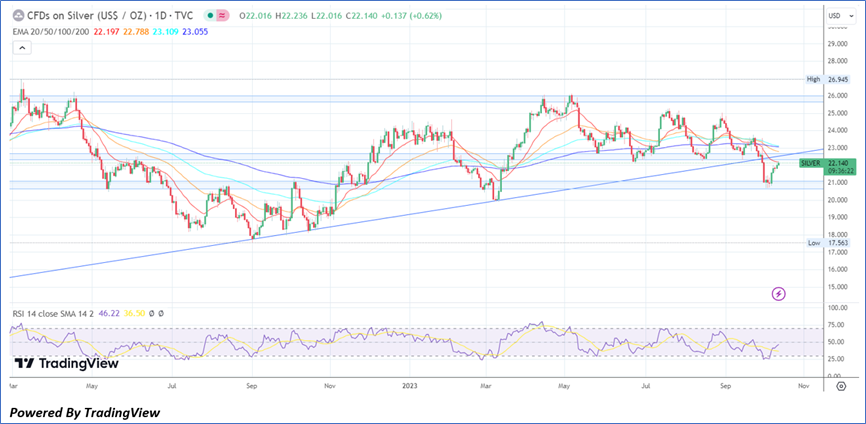
1.5 Underlying Commodities Analysis:
Silver prices rebounded from a recent low of USD 20.9 per ounce on October 5th, reaching USD22 per ounce, driven by a weakened dollar and declining Treasury yields as the market assessed the Federal Reserve's monetary policy. The latest FOMC meeting minutes indicated the Fed's concern about potential overtightening risks and the uncertainty regarding the need for another interest rate hike in the current economic cycle. This sentiment aligns with recent statements by FOMC members, suggesting that tighter credit conditions resulting from higher bond yields may align with the Fed's monetary objectives, potentially eliminating the need for further rate hikes. Furthermore, the recovery of government bonds in the second week of October had a positive impact on solar panel producers' equities, bolstering the outlook for silver's demand as an essential industrial input.
Section 2: Business Updates and Corporate Business Highlights
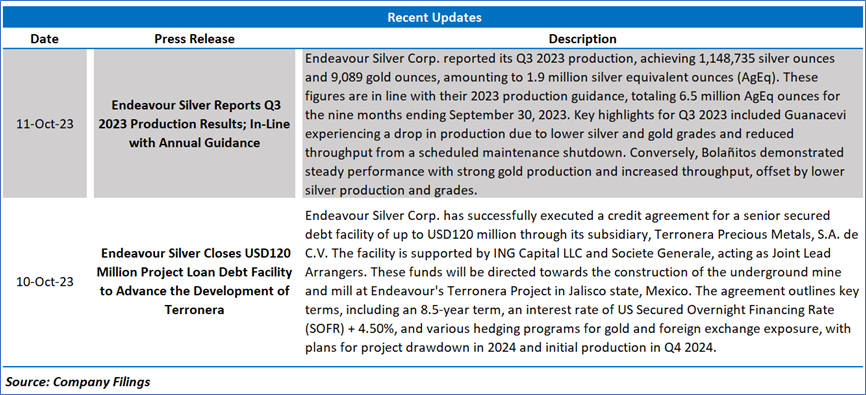
2.1 Recent Updates:
The below picture gives an overview of the recent updates:
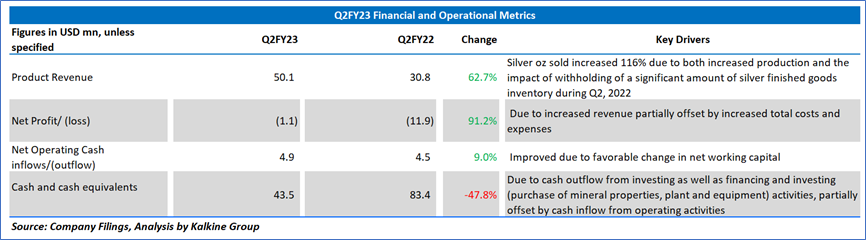
2.2 Insights of Q2FY23:
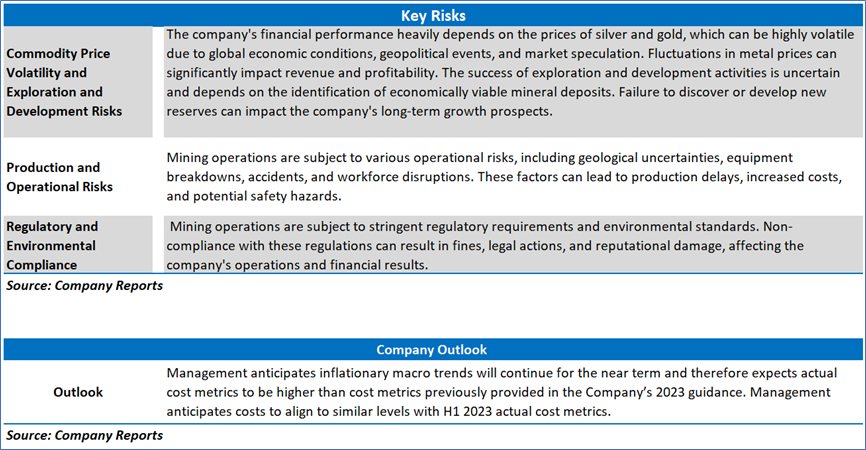
Section 3: Key Risks & Outlook
Section 4: Stock Recommendation Summary:
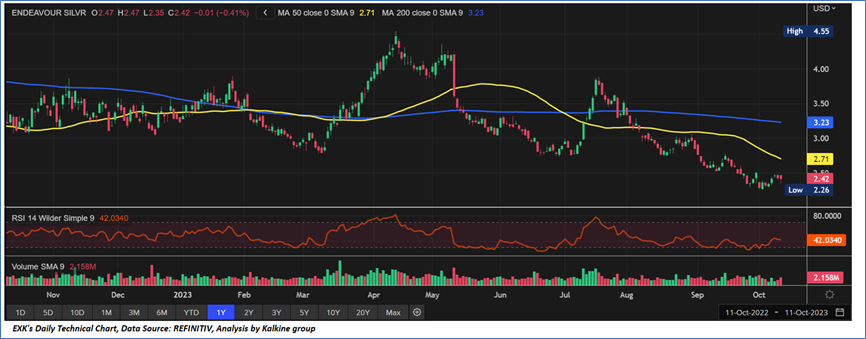
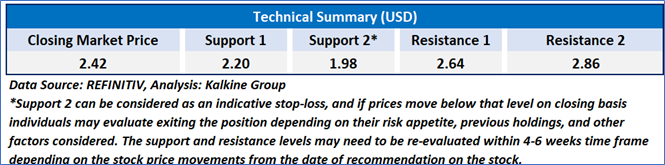
4.1 Price Performance and Technical Summary:
Stock Performance:
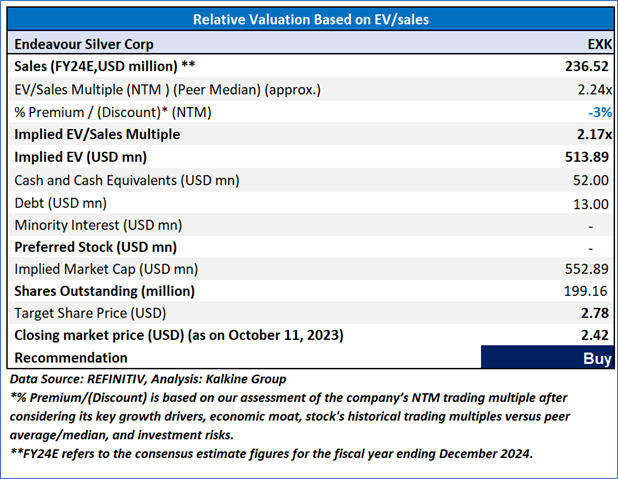
4.2 Fundamental Valuation
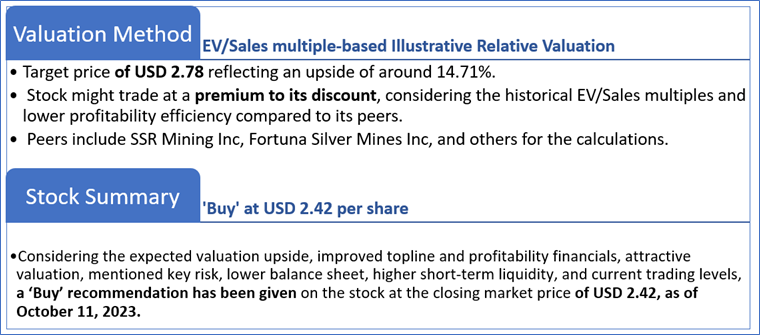
Valuation Methodology: EV/Sales Multiple Based Relative Valuation
Markets are trading in a highly volatile zone currently due to certain macroeconomic issues and geopolitical tensions prevailing. Therefore, it is prudent to follow a cautious approach while investing.
Note 1: Past performance is not a reliable indicator of future performance.
Note 2: The reference date for all price data, currency, technical indicators, support, and resistance levels is October 11, 2023. The reference data in this report has been partly sourced from REFINITIV.
Note 3: Investment decisions should be made depending on an individual's appetite for upside potential, risks, holding duration, and any previous holdings. An 'Exit' from the stock can be considered if the Target Price mentioned as per the Valuation and or the technical levels provided has been achieved and is subject to the factors discussed above.
Note 4: The report publishing date is as per the Pacific Time Zone.
Technical Indicators Defined: -
Support: A level at which the stock prices tend to find support if they are falling, and a downtrend may take a pause backed by demand or buying interest. Support 1 refers to the nearby support level for the stock and if the price breaches the level, then Support 2 may act as the crucial support level for the stock.
Resistance: A level at which the stock prices tend to find resistance when they are rising, and an uptrend may take a pause due to profit booking or selling interest. Resistance 1 refers to the nearby resistance level for the stock and if the price surpasses the level, then Resistance 2 may act as the crucial resistance level for the stock.
Stop-loss: It is a level to protect against further losses in case of unfavorable movement in the stock prices.
Kalkine Equities LLC provides general information about companies and their securities. The information contained in the reports, including any recommendations regarding the value of or transactions in any securities, does not take into account any of your investment objectives, financial situation or needs. Kalkine Equities LLC is not registered as an investment adviser in the U.S. with either the federal or state government. Before you make a decision about whether to invest in any securities, you should take into account your own objectives, financial situation and needs and seek independent financial advice. All information in our reports represents our views as at the date of publication and may change without notice.
Kalkine Media LLC, an affiliate of Kalkine Equities LLC, may have received, or be entitled to receive, financial consideration in connection with providing information about certain entity(s) covered on its website.
Past performance is not a reliable indicator of future performance.
 Please wait processing your request...