
Section 1: Company Overview and Fundamentals
1.1 Company Overview:
Endeavour Silver Corp. (NYSE: EXK) is a Canada-based precious metals mining company. The Company is engaged in silver mining in Mexico and related activities, including property acquisition, exploration, development, mineral extraction, processing, refining and reclamation. The Company operates two high-grade underground silver-gold mines in Mexico.
Kalkine’s Diversified Opportunities Report covers the Company Overview, Key positives & negatives, Investment summary, Key investment metrics, Top 10 shareholding, Business updates and insights into company recent financial results, Key Risks & Outlook, Price performance and technical summary, Target Price, and Recommendation on the stock.
Price Performance:
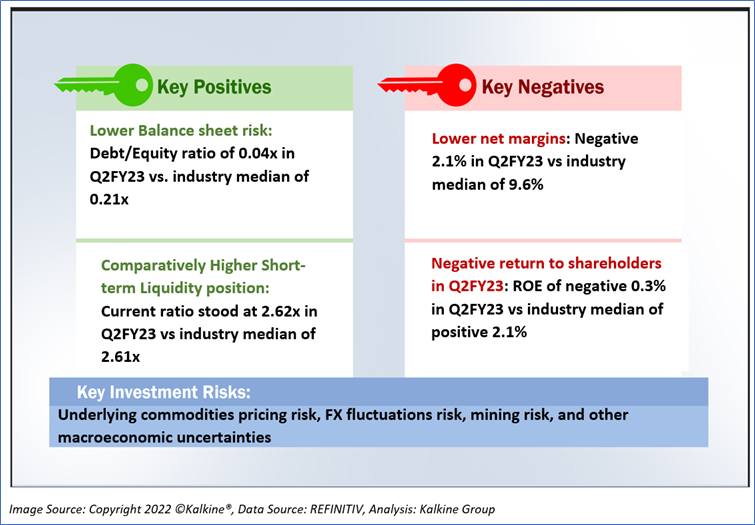
1.2 The Key Positives, Negatives, and Investment summary
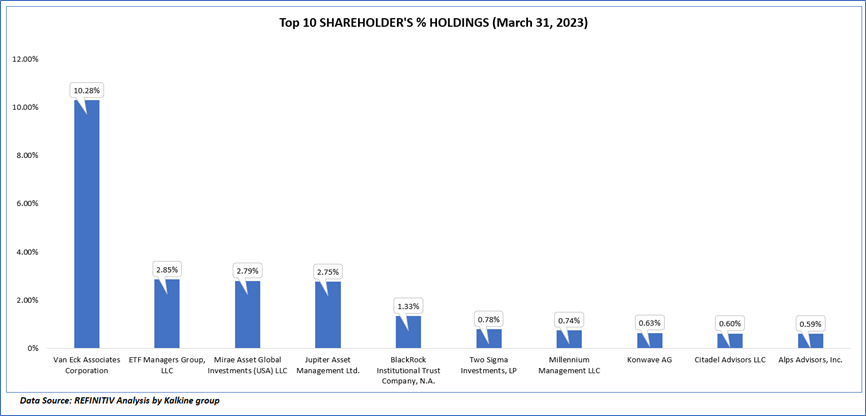
1.3 Top 10 shareholders:
The top 10 shareholders together form ~23.34% of the total shareholding, signifying diverse shareholding. Van Eck Associates Corporation, and ETF Managers Group, LLC are the biggest shareholders, holding the maximum stake in the company at ~10.28% and ~2.85%, respectively.
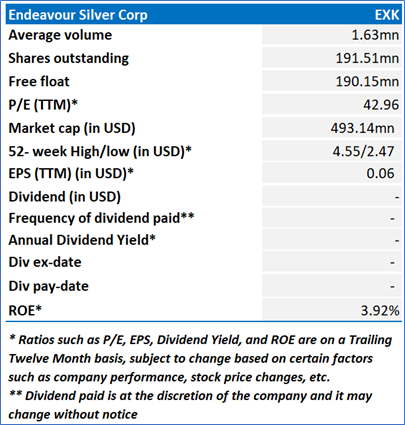
1.4 Key Metrics:
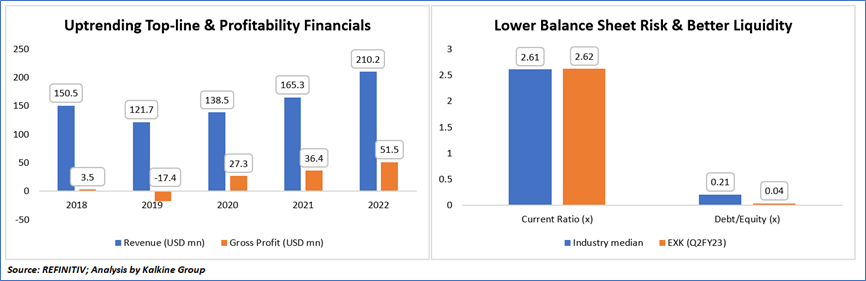
Endeavour Silver Corp. (EXK) has demonstrated consistent upward trends in its revenue and profitability metrics over the past five years, except for 2019. In that year, the company faced a decline in revenue and reported a negative gross profit. Several factors contributed to this downturn, including a significant drop in silver prices of approximately 20%, a decrease in production volume by about 10%, and an increase in overall expenses. However, over the specified period, EXK's revenue showed substantial growth, increasing from USD 150.5 million in fiscal year 2018 to USD 210.2 million in fiscal year 2022. Similarly, the company's gross profit also experienced remarkable expansion, rising from USD 3.5 million in fiscal year 2018 to USD 51.5 million in fiscal year 2022. Despite the temporary setback in 2019, EXK has successfully recovered and achieved significant financial improvements in subsequent years. This underscores the effectiveness of the company's strategic efforts to enhance revenue and profitability in the latter years of the five-year period.
Furthermore, an analysis of EXK's financial health reveals lower balance sheet risk, as indicated by a comparatively lower debt/equity ratio when compared to the industry median. This demonstrates a prudent approach to financial leverage and risk management. Additionally, EXK's financial stability is bolstered by its strong short-term liquidity position, characterized by a higher current ratio in comparison to the industry median. This signifies the company's capability to meet its short-term obligations and highlights a positive aspect of its financial management.
1.5 Underlying Commodities Analysis:
Silver prices hit a four-week low at USD 22.6 per ounce due to the strengthening US dollar, fueled by signs of a robust US economy, raising expectations that the Federal Reserve will keep borrowing costs high, potentially leading to another rate hike in November. This situation not only makes the dollar more appealing but also increases the opportunity cost of holding non-interest-bearing assets like silver, while also dampening silver's demand for industrial applications such as solar panels and sustainable energy methods, as seen in the decline of solar energy equity indices.
On the other hand, gold remained relatively stable at around USD 1,910 per ounce as investors digested the latest US consumer inflation report, which had a limited impact on Federal Reserve monetary policy expectations. The annual headline inflation rate in the US rose for the second consecutive month, reaching 3.7% in August, slightly exceeding market projections of 3.6%. However, the annual core inflation rate, which carries more weight in central bank policy decisions, eased to 4.3% in August from 4.7% in July, aligning with expectations. It is currently expected to be a 97% likelihood that the Fed will maintain rates in the upcoming meeting, with reduced anticipations for a rate hike in November.
Section 2: Business Updates and Corporate Business Highlights
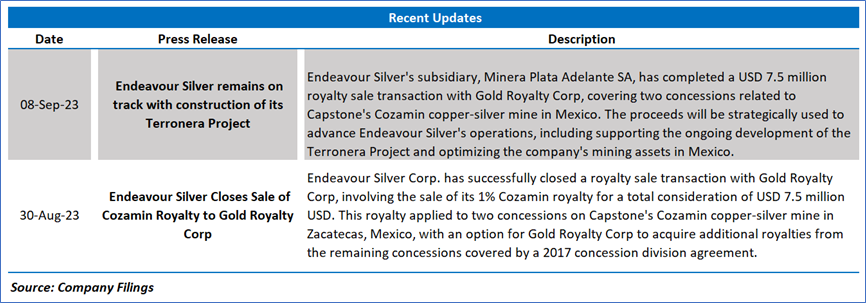
2.1 Recent Updates:
The below picture gives an overview of the recent updates:
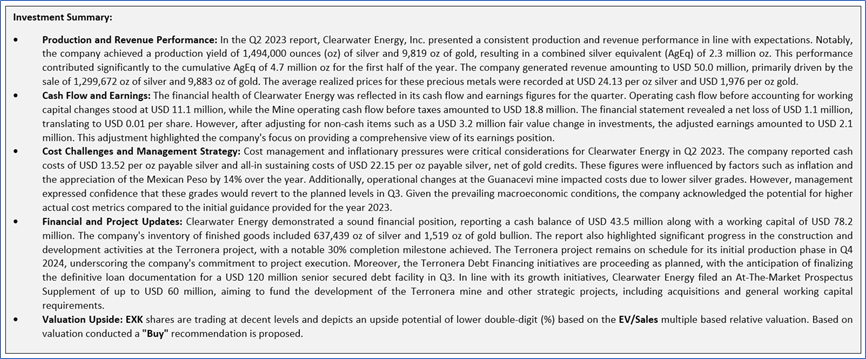
2.2 Insights of Q2FY23:
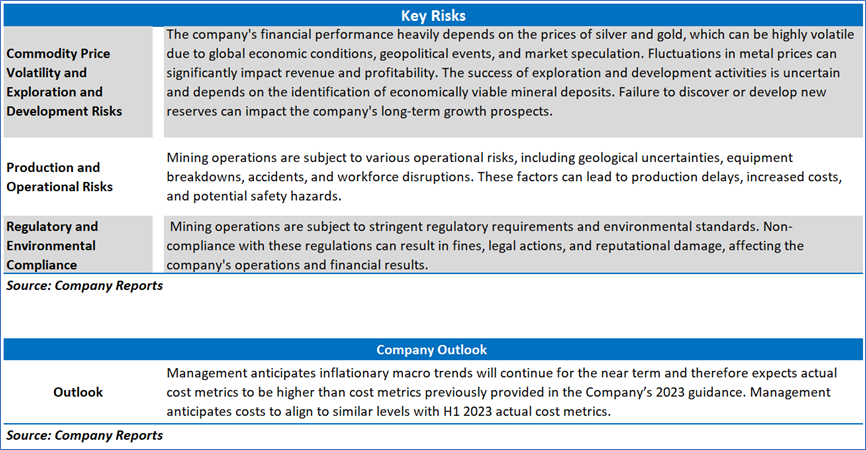
Section 3: Key Risks & Outlook
Section 4: Stock Recommendation Summary:
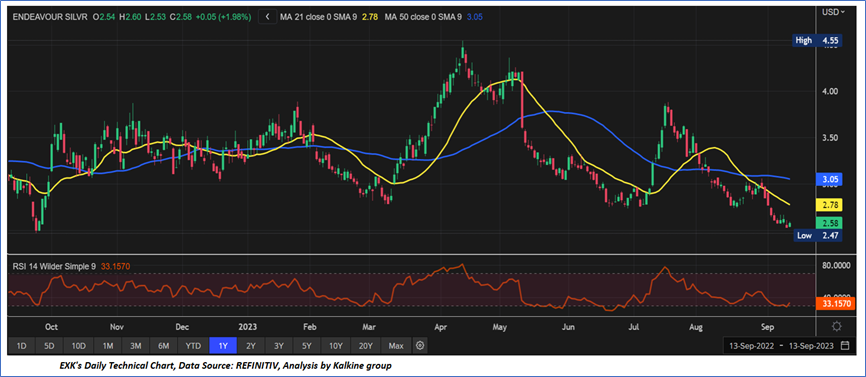
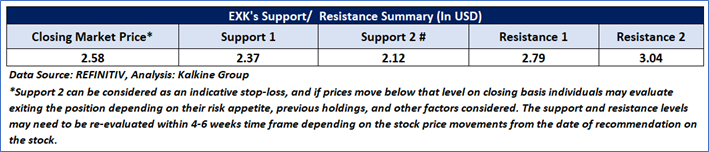
4.1 Price Performance and Technical Summary:
Stock Performance:
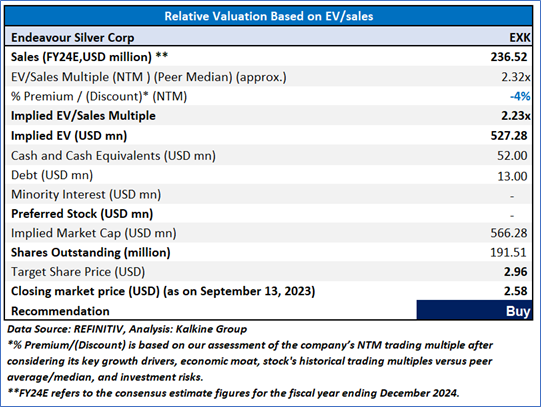
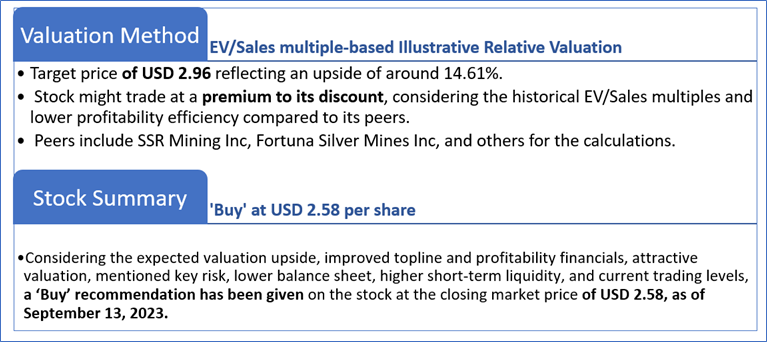
4.2 Fundamental Valuation
Valuation Methodology: EV/Sales Multiple Based Relative Valuation
Markets are trading in a highly volatile zone currently due to certain macroeconomic issues and geopolitical tensions prevailing. Therefore, it is prudent to follow a cautious approach while investing.
Note 1: Past performance is not a reliable indicator of future performance.
Note 2: The reference date for all price data, currency, technical indicators, support, and resistance levels is September 13, 2023. The reference data in this report has been partly sourced from REFINITIV.
Note 3: Investment decisions should be made depending on an individual's appetite for upside potential, risks, holding duration, and any previous holdings. An 'Exit' from the stock can be considered if the Target Price mentioned as per the Valuation and or the technical levels provided has been achieved and is subject to the factors discussed above.
Note 4: The report publishing date is as per the Pacific Time Zone.
Technical Indicators Defined: -
Support: A level at which the stock prices tend to find support if they are falling, and a downtrend may take a pause backed by demand or buying interest. Support 1 refers to the nearby support level for the stock and if the price breaches the level, then Support 2 may act as the crucial support level for the stock.
Resistance: A level at which the stock prices tend to find resistance when they are rising, and an uptrend may take a pause due to profit booking or selling interest. Resistance 1 refers to the nearby resistance level for the stock and if the price surpasses the level, then Resistance 2 may act as the crucial resistance level for the stock.
Stop-loss: It is a level to protect against further losses in case of unfavorable movement in the stock prices.
Kalkine Equities LLC provides general information about companies and their securities. The information contained in the reports, including any recommendations regarding the value of or transactions in any securities, does not take into account any of your investment objectives, financial situation or needs. Kalkine Equities LLC is not registered as an investment adviser in the U.S. with either the federal or state government. Before you make a decision about whether to invest in any securities, you should take into account your own objectives, financial situation and needs and seek independent financial advice. All information in our reports represents our views as at the date of publication and may change without notice.
Kalkine Media LLC, an affiliate of Kalkine Equities LLC, may have received, or be entitled to receive, financial consideration in connection with providing information about certain entity(s) covered on its website.
Past performance is not a reliable indicator of future performance.
 Please wait processing your request...