
Section 1: Company Fundamentals
1.1 Company Overview and Performance summary
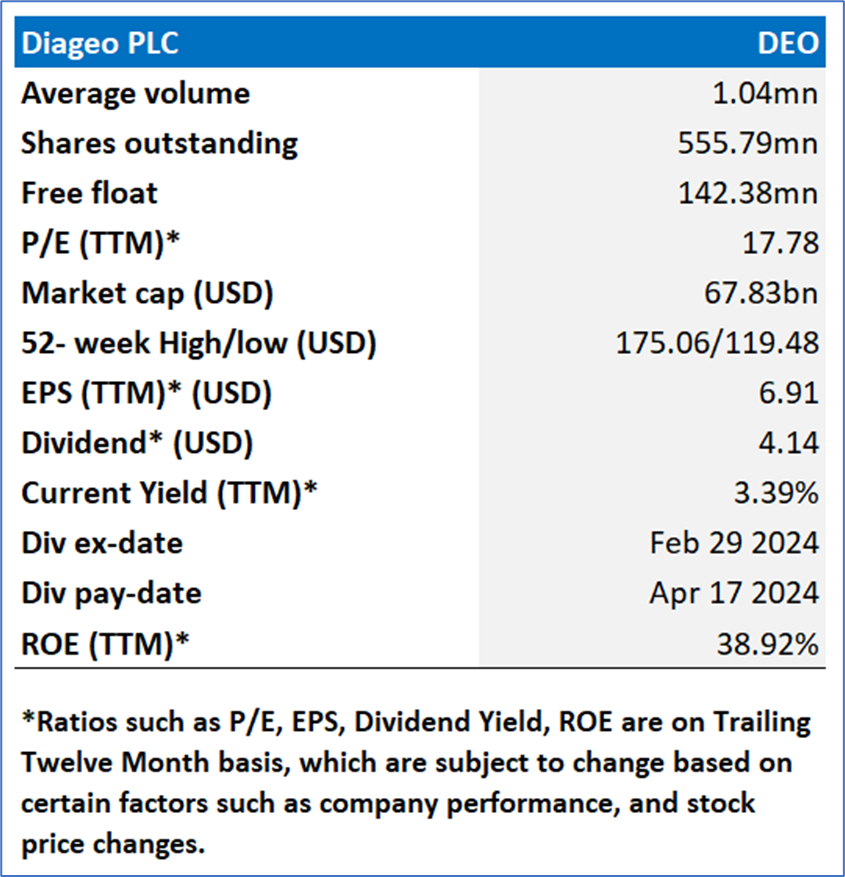
Company Overview:
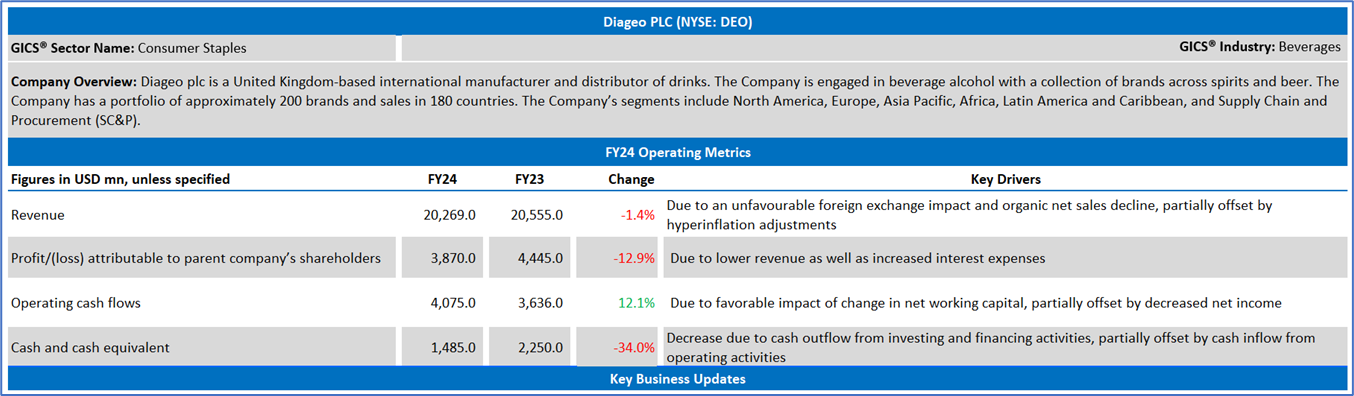
Diageo plc (NYSE: DEO) is a United Kingdom-based international manufacturer and distributor of drinks. The Company is engaged in beverage alcohol with a collection of brands across spirits and beer. The Company has a portfolio of approximately 200 brands and sales in 180 countries. The Company’s segments include North America, Europe, Asia Pacific, Africa, Latin America and Caribbean, and Supply Chain and Procurement (SC&P).
This US Inflation Report covers the Company Overview & Price performance, Summary table, Key positives & negatives, Key metrics, Company details, technical guidance & Stock recommendation, and Price chart.
Price Performance:
1.2 Summary Table
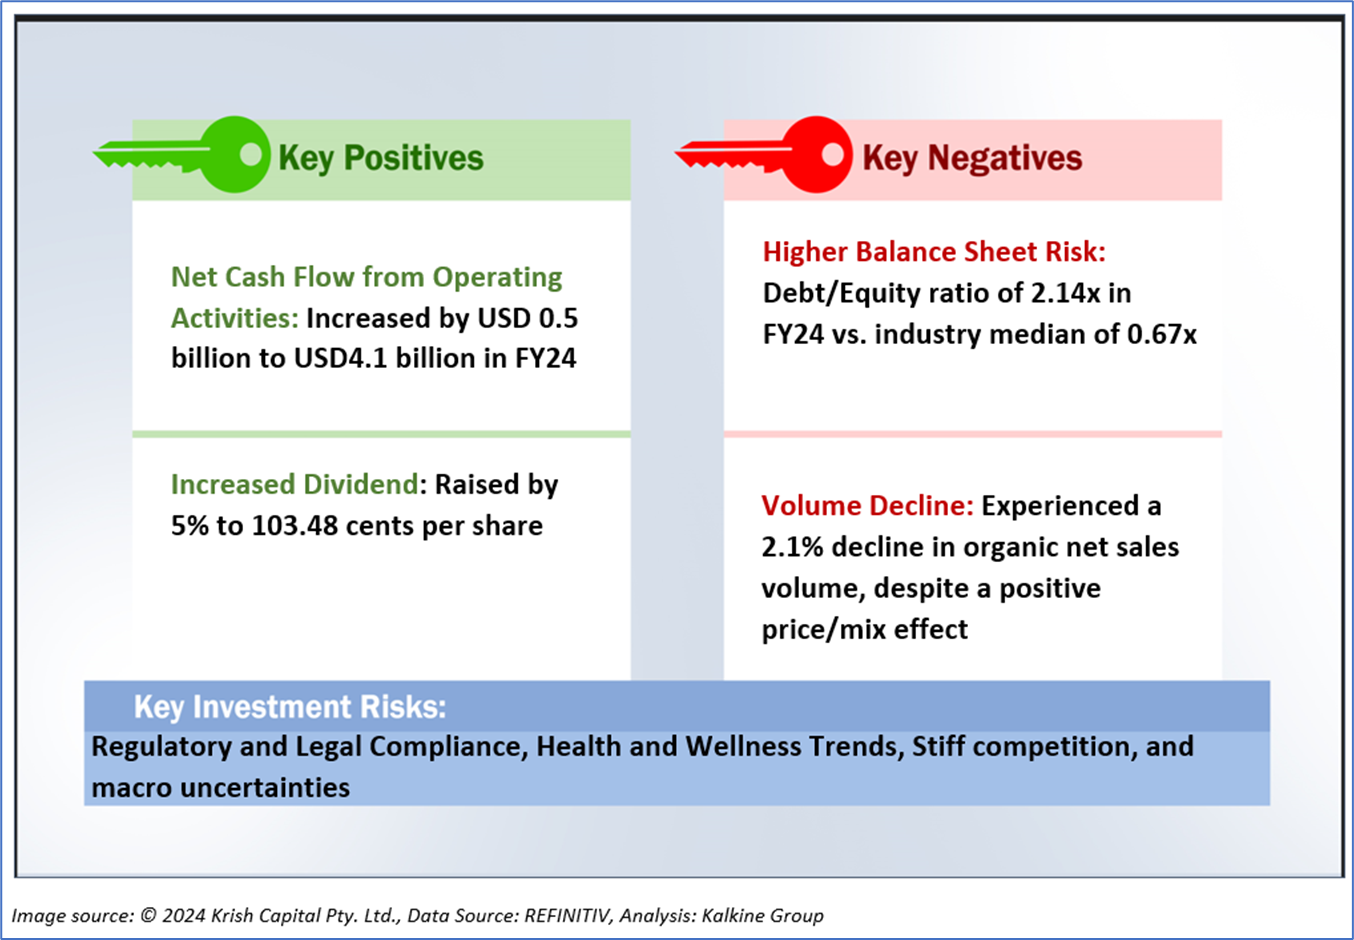
1.3 The Key Positives & Negatives
1.4 Key Metrics
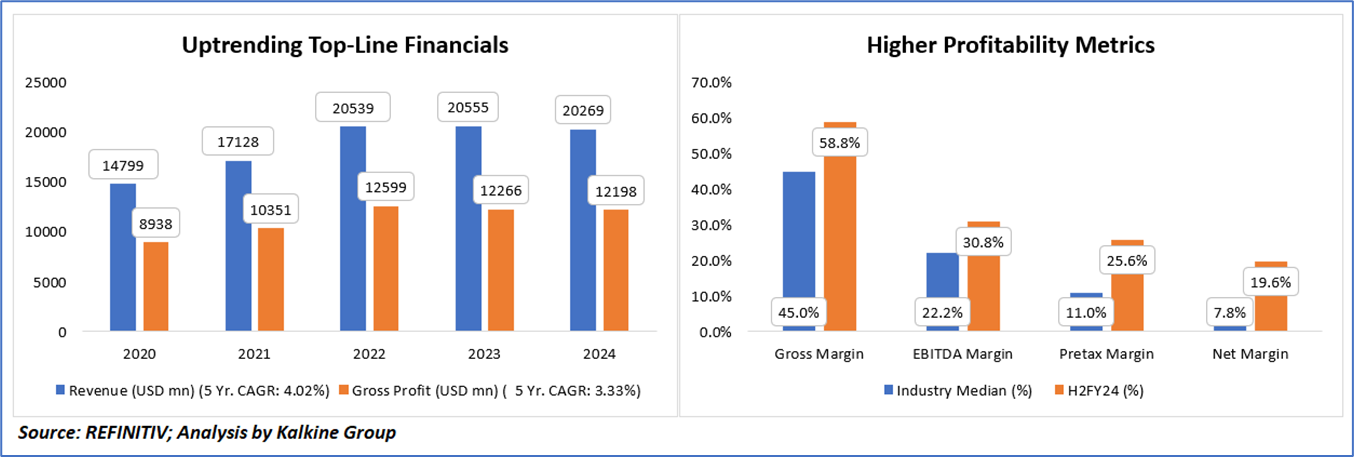
DEO has demonstrated up trending financial performance from 2020 to 2024, with a steady increase in revenue, achieving a Compound Annual Growth Rate (CAGR) of 4.02%. Gross profit also saw growth, with a five-year CAGR of 3.33%. Notably, DEO’s performance significantly surpasses industry medians in key profitability metrics for the second half of fiscal year 2024. The company's gross margin stands at an impressive 58.8% compared to the industry median of 45.0%, while its EBITDA, pretax, and net margins are markedly higher than their respective industry medians. This superior performance underscores DEO's robust financial health and competitive advantage within its industry.
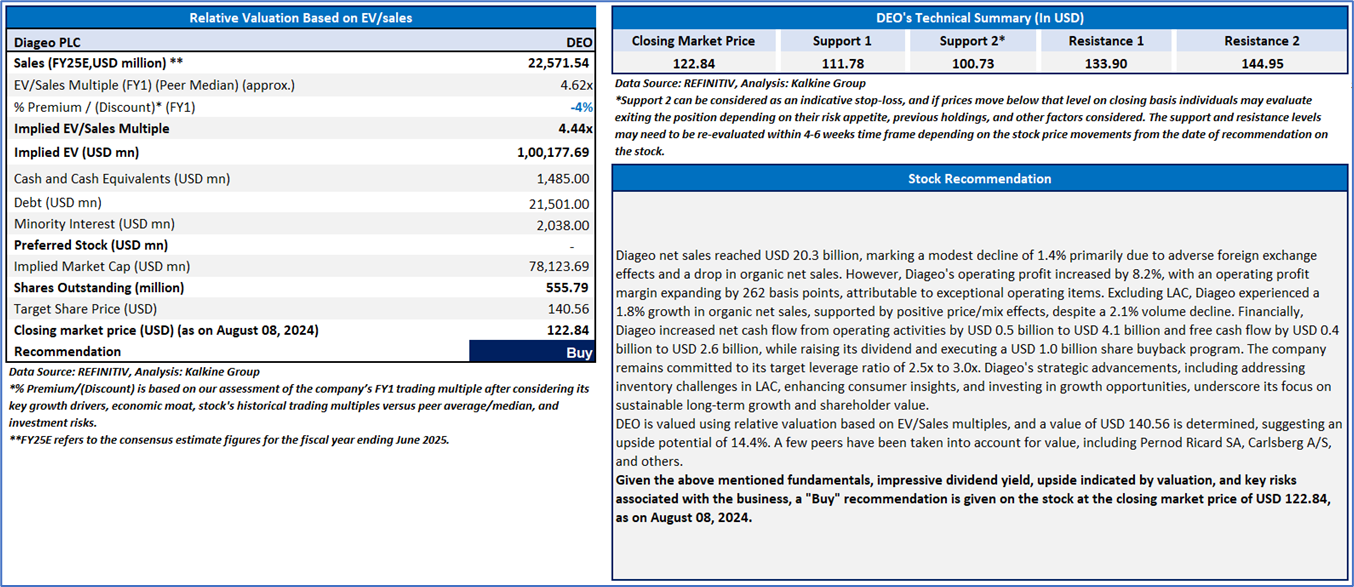
Section 2: Diageo PLC (NYSE: DEO) (“Buy” at the closing market price of USD 122.84, as of August 08, 2024)
2.1 Company Details
2.2 Technical Guidance and Stock Recommendation
Markets are trading in a highly volatile zone currently due to certain macroeconomic issues and geopolitical tensions prevailing. Therefore, it is prudent to follow a cautious approach while investing.
Note 1: Past performance is not a reliable indicator of future performance.
Note 2: The reference date for all price data, currency, technical indicators, support, and resistance levels is August 08, 2024. The reference data in this report has been partly sourced from REFINITIV.
Note 3: Investment decisions should be made depending on an individual's appetite for upside potential, risks, holding duration, and any previous holdings. An 'Exit' from the stock can be considered if the Target Price mentioned as per the Valuation and or the technical levels provided has been achieved and is subject to the factors discussed above.
Note 4: The report publishing date is as per the Pacific Time Zone.
Technical Indicators Defined: -
Support: A level at which the stock prices tend to find support if they are falling, and a downtrend may take a pause backed by demand or buying interest. Support 1 refers to the nearby support level for the stock and if the price breaches the level, then Support 2 may act as the crucial support level for the stock.
Resistance: A level at which the stock prices tend to find resistance when they are rising, and an uptrend may take a pause due to profit booking or selling interest. Resistance 1 refers to the nearby resistance level for the stock and if the price surpasses the level, then Resistance 2 may act as the crucial resistance level for the stock.
Stop-loss: It is a level to protect against further losses in case of unfavorable movement in the stock prices.
Kalkine Equities LLC, with Delaware File Number 4697384, Foreign Qualification Registration in California File Number 202109211078, and Texas File Number 805521396, is authorized to provide general advice only. The information on https://kalkine.com/ does not take into account any of your investment objectives, financial situation or needs. You should consider the appropriateness of advice taking into account your own objectives, financial situation and needs and seek independent financial advice before making any financial decisions. The link to our Terms and Conditions and Privacy Policy has been provided for your reference. On the date of publishing the reports (mentioned on the website), employees and/or associates of Kalkine do not hold positions in any of the stocks covered on the website. These stocks can change any time and readers of the reports should not consider these stocks as advice or recommendations later.
Copyright © 2024 Krish Capital Pty Ltd. All rights reserved.
 US
US  AU
AU UK
UK CA
CA NZ
NZ Please wait processing your request...