Section 1: Company Overview and Fundamentals
1.1 Company Overview:
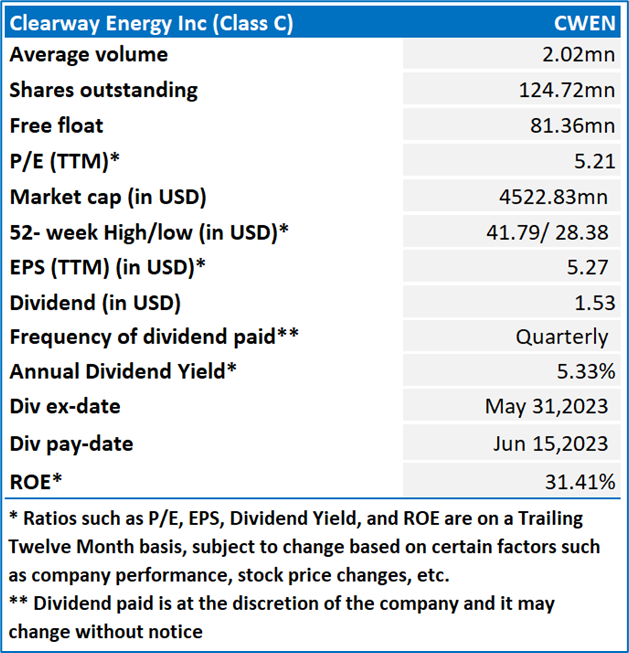
Clearway Energy, Inc. (Class C) (NYSE: CWEN) is a renewable energy company. The Company is an energy infrastructure investor and owner of long-term contracted assets across North America. Its segments include Conventional and Renewables. The Company's businesses are segregated based on conventional power generation, and renewable businesses, which consist of solar and wind.
Kalkine’s Dividend Income Report covers the Company Overview, Key positives & negatives, investment summary, Business updates and insights into company recent financial results, Key Risks & Outlook, Price performance and technical summary, Target Price, and Recommendation on the stock.
Stock Performance:
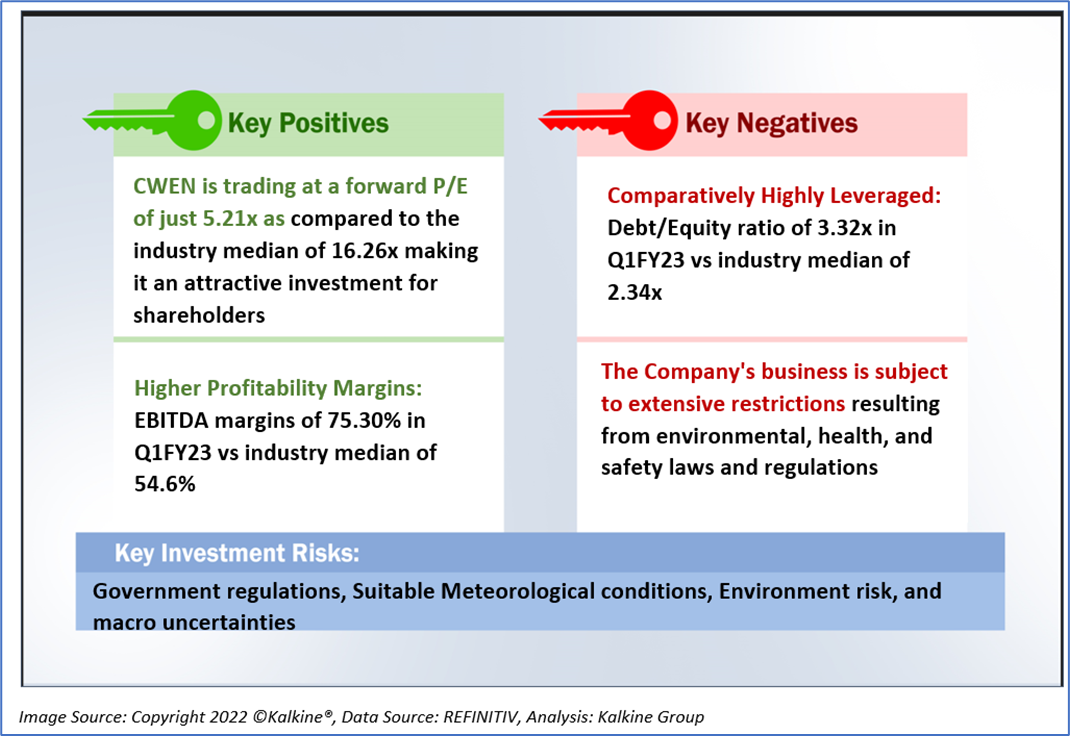
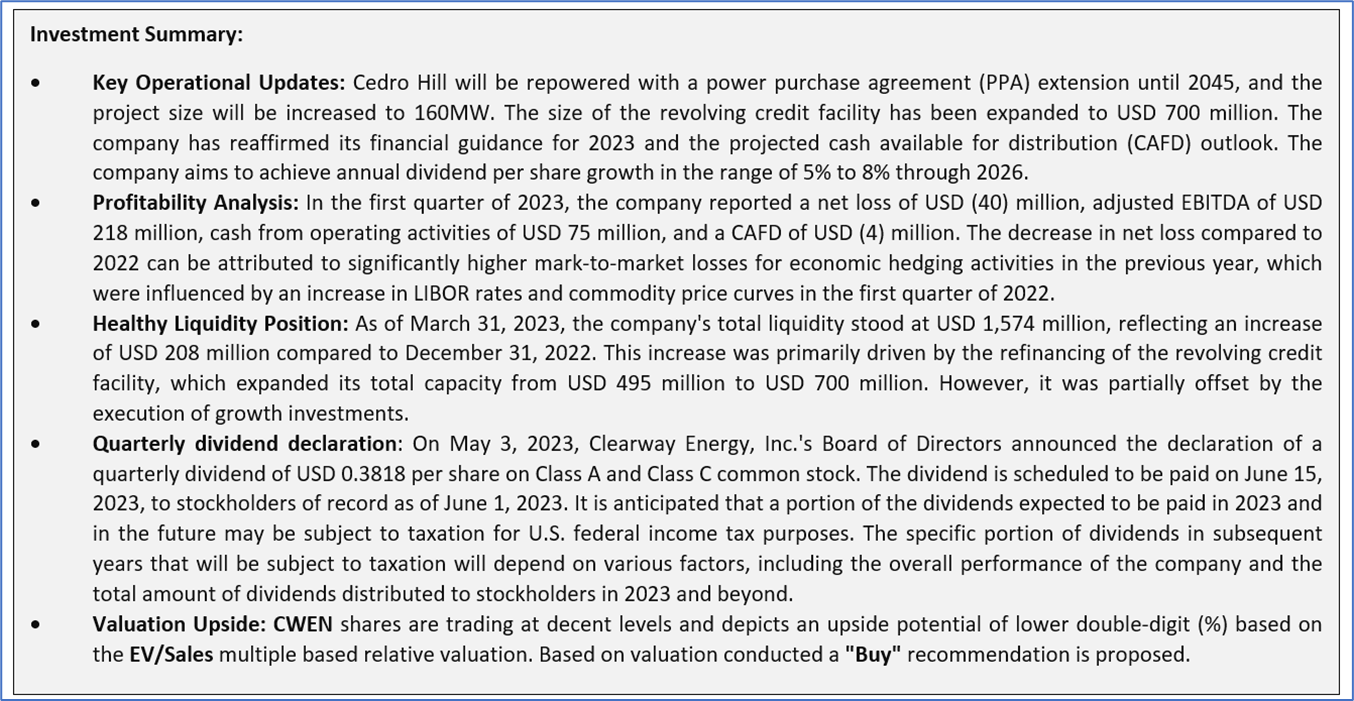
1.2 The Key Positives, Negatives, and Investment summary
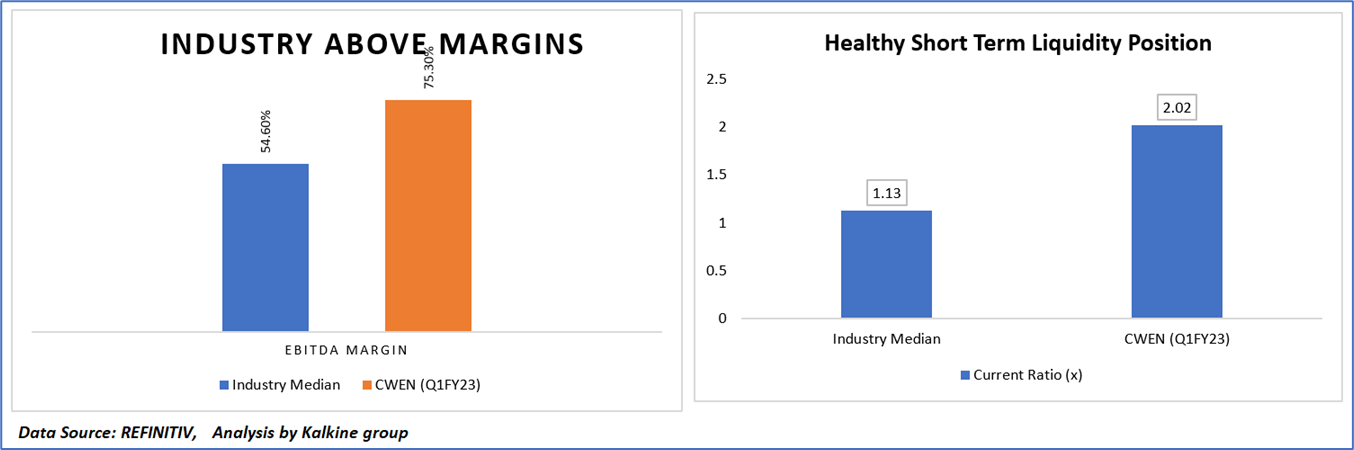
1.3 Key Metrics:
CWEN has performed comparatively better and more efficiently than its peers, which can be seen through the higher profitability margin. Additionally, the other graph shows how CWEN is efficiently using its assets and paying down obligations in comparison to its peer maintaining a healthy liquidity position.
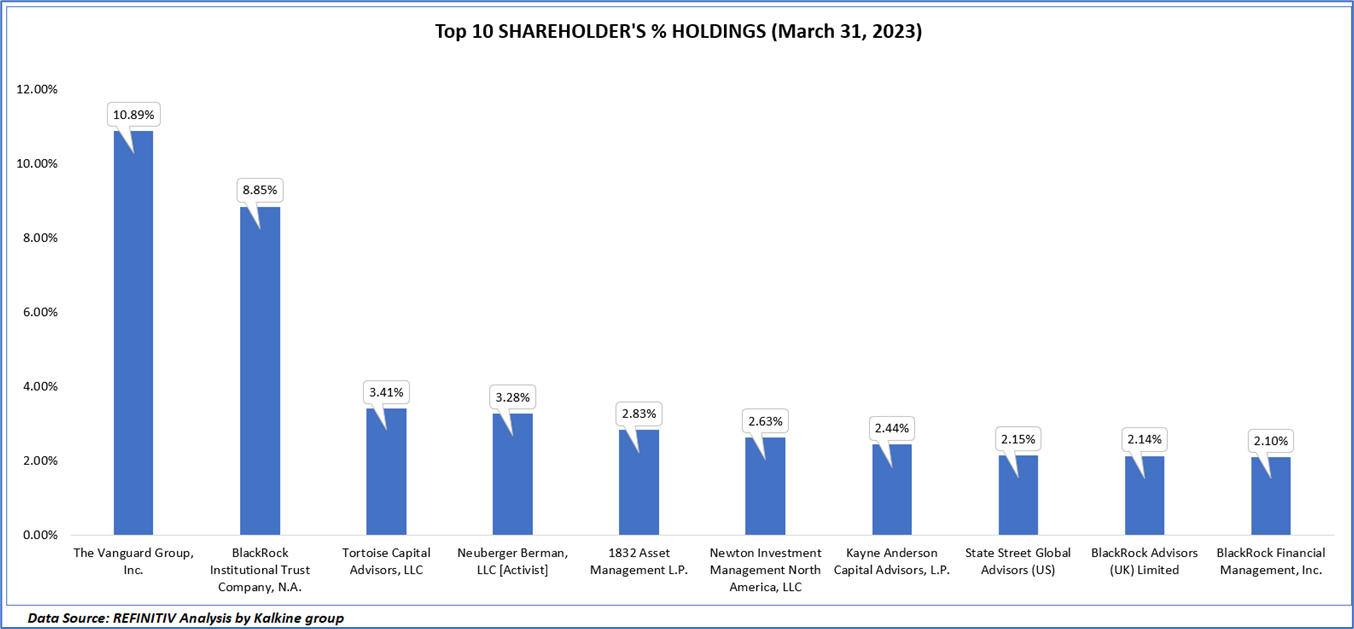
1.4 Top 10 shareholders:
The top 10 shareholders together form ~40.72% of the total shareholding, signifying diverse shareholding. The Vanguard Group, Inc, and BlackRock Institutional Trust Company, N.A. are the biggest shareholders, holding the maximum stake in the company at ~10.89% and ~8.85%, respectively.
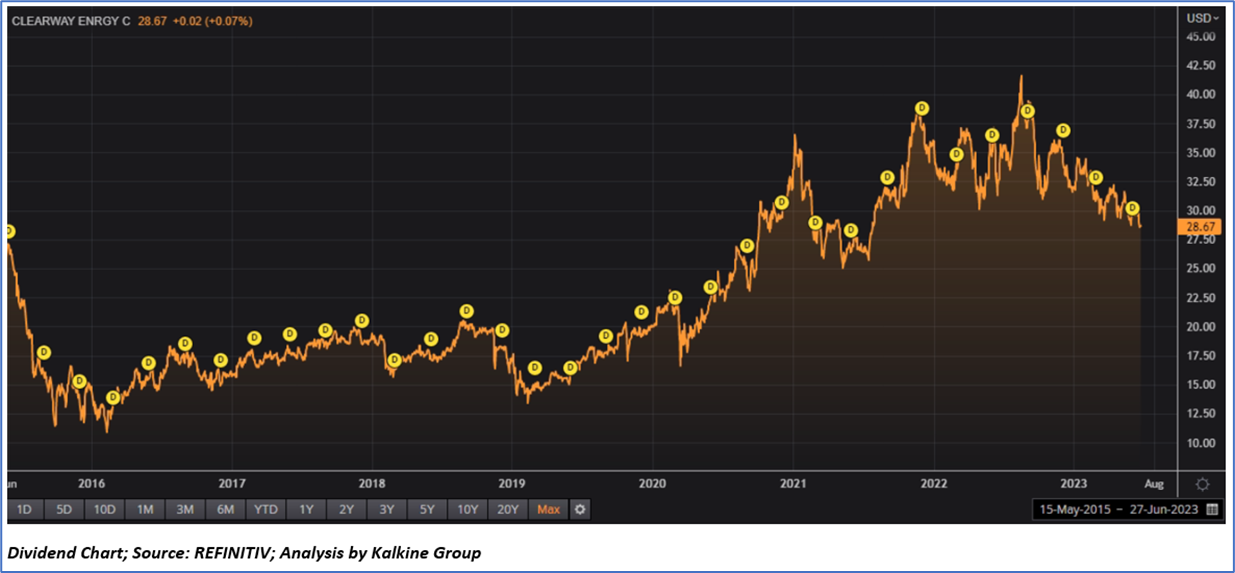
1.5 Consistent dividend History
CWEN has been paying dividends since 2015, CWEN has a track record of consistent dividend payments with a current dividend yield of 5.33%. On May 3, 2023, Clearway Energy, Inc.'s Board of Directors announced the declaration of a quarterly dividend of USD 0.3818 per share on Class A and Class C common stock. The dividend is scheduled to be paid on June 15, 2023, to stockholders of record as of June 1, 2023. It is anticipated that a portion of the dividends expected to be paid in 2023 and in the future may be subject to taxation for U.S. federal income tax purposes.
Section 2: Business Updates and Corporate Business Highlights
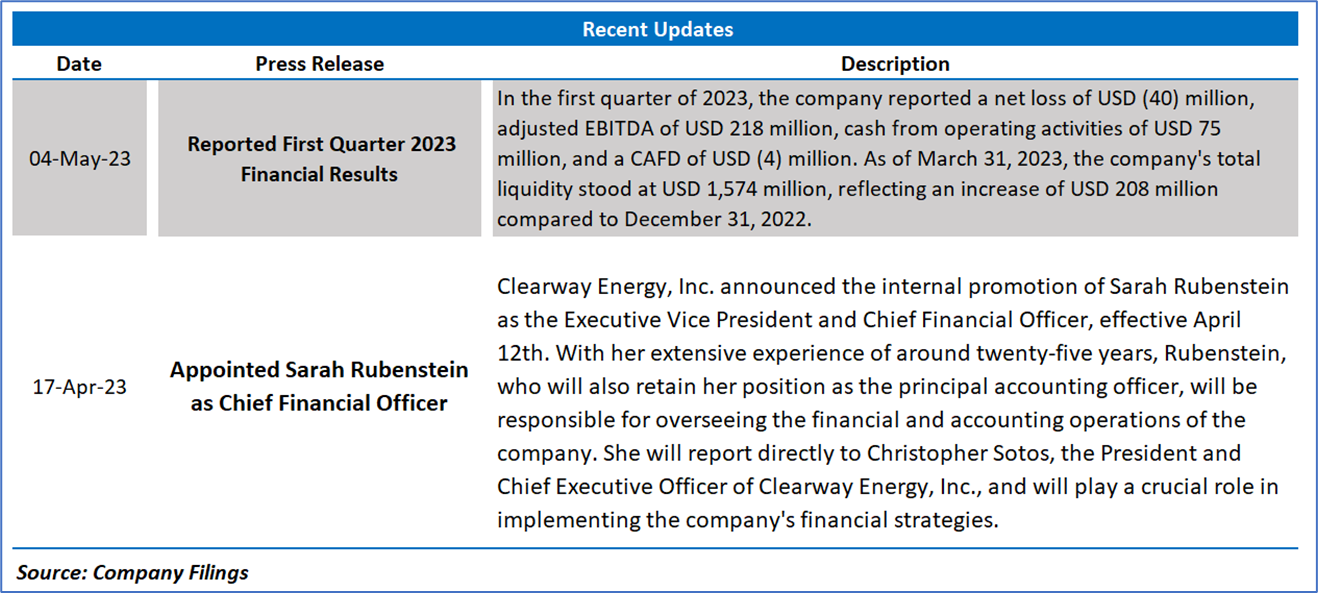
2.1 Recent Updates:
The below picture gives an overview of the recent updates:
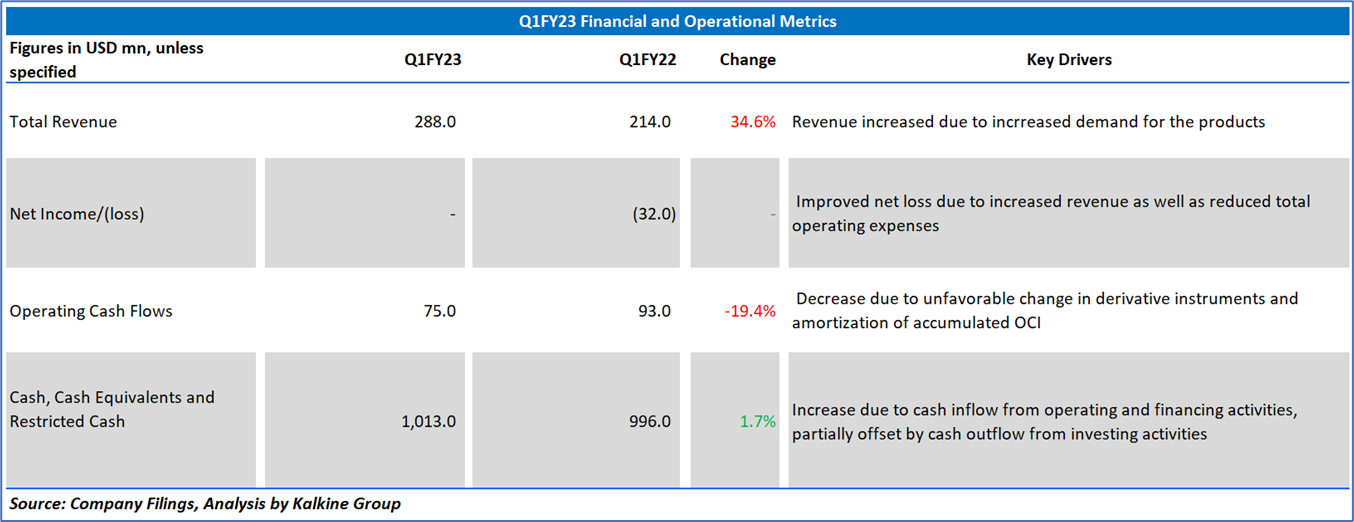
2.2 Insights of Q1FY23:
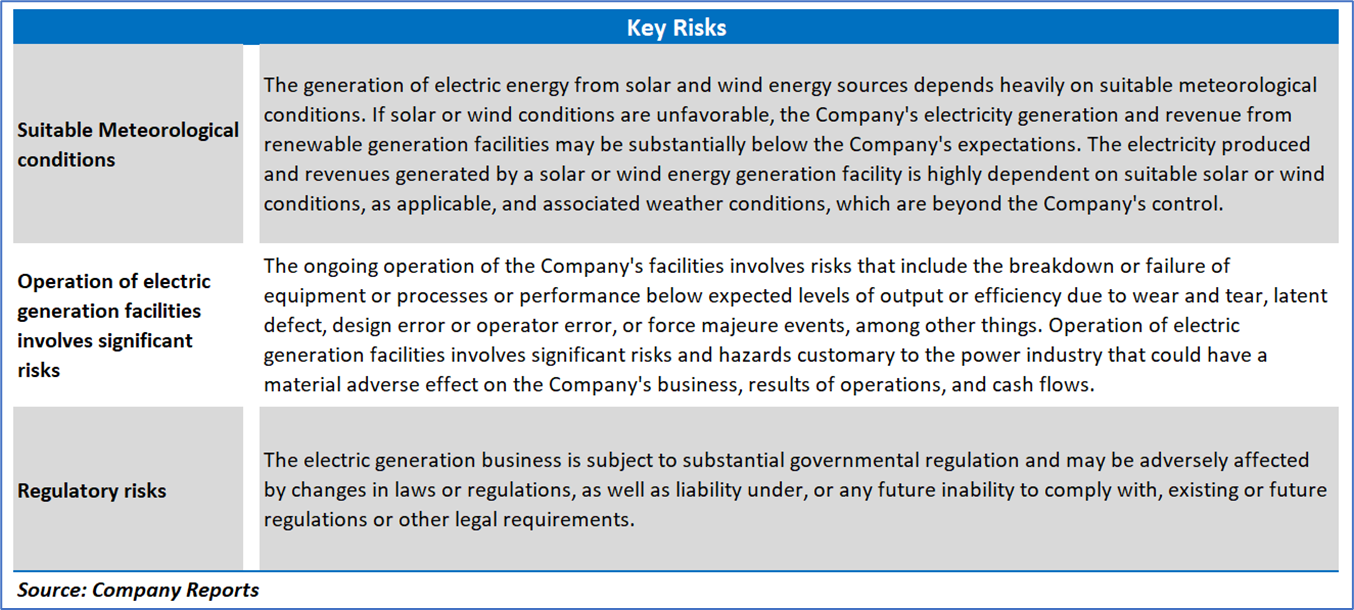
Section 3: Key Risks
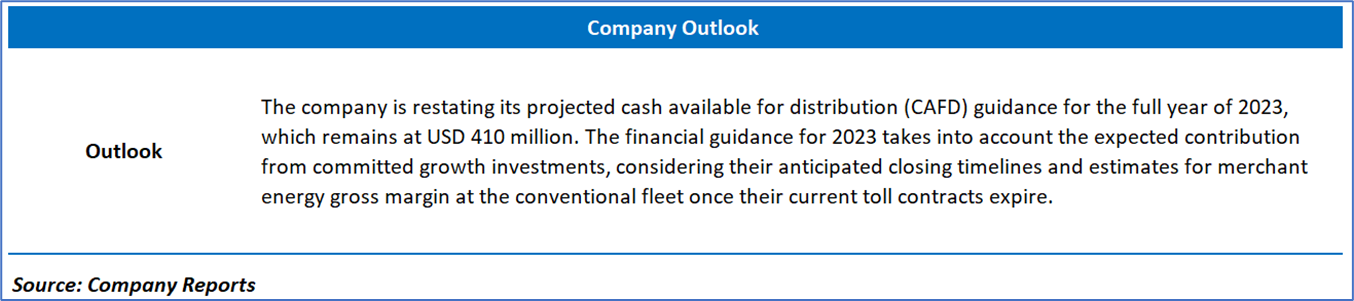
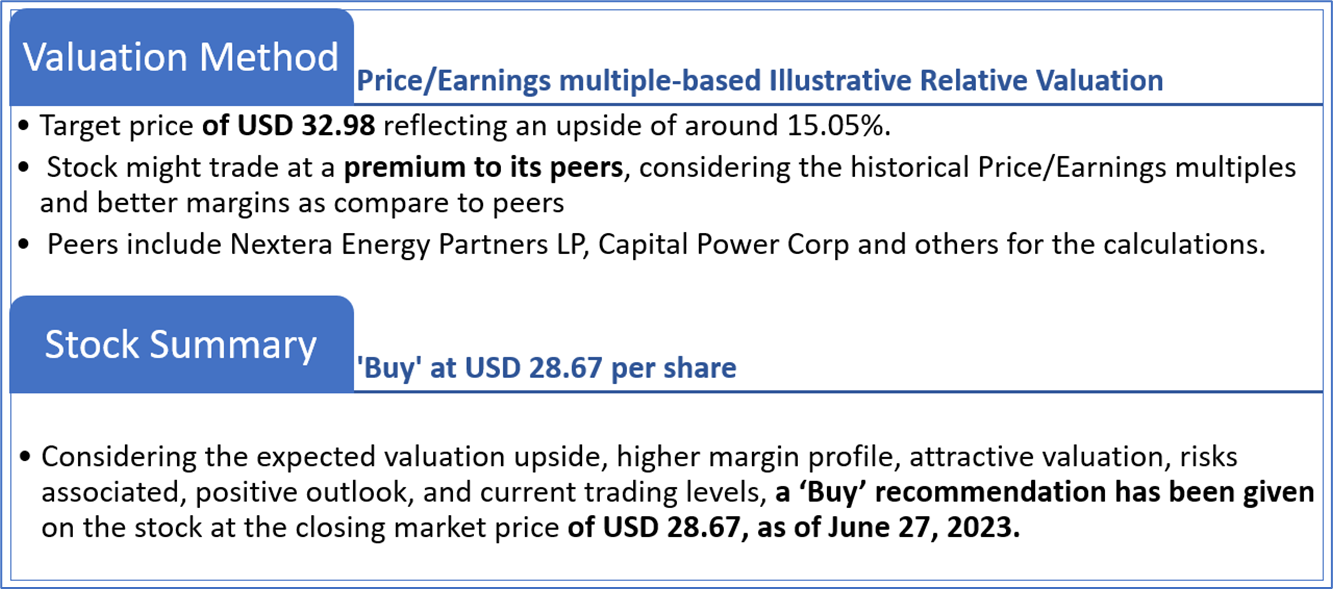
Section 4: Stock Recommendation Summary:
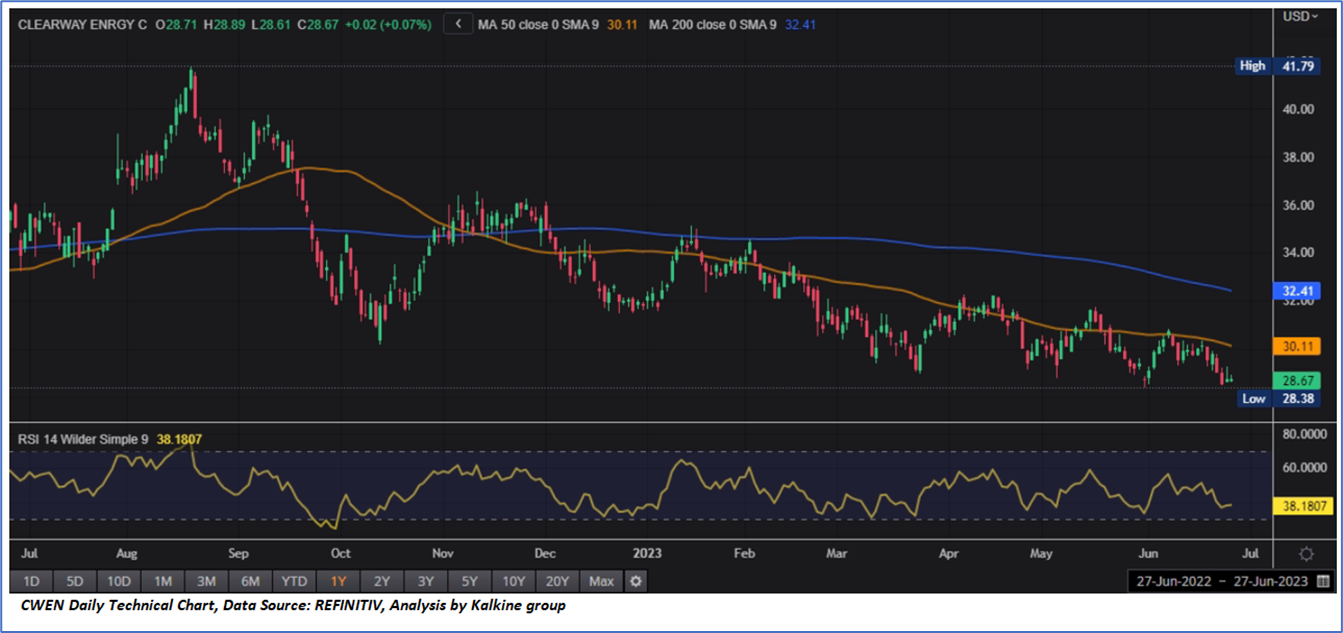
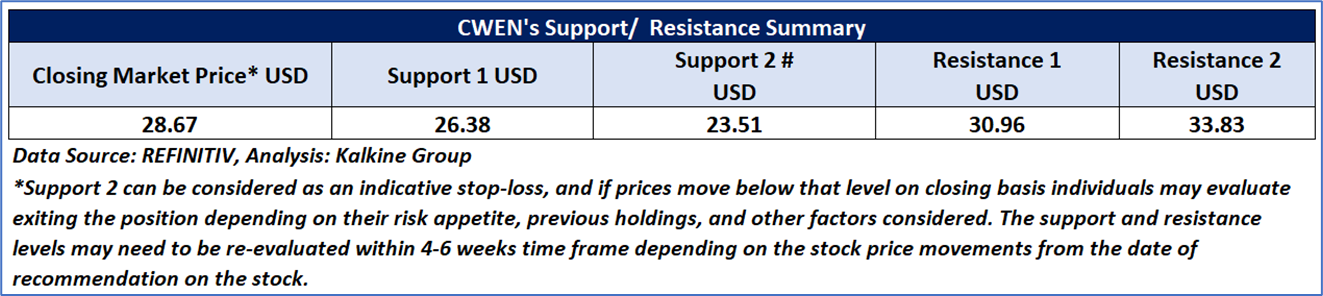
4.1 Price Performance and Technical Summary:
Stock Performance:
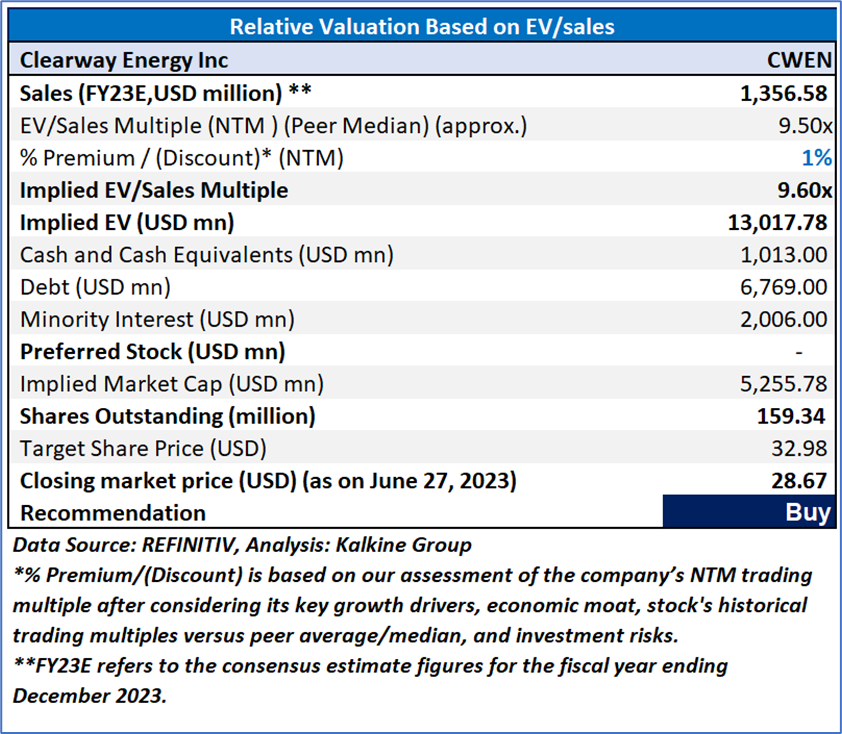
4.2 Fundamental Valuation
Valuation Methodology: EV/Sales per share Multiple Based Relative Valuation
Markets are trading in a highly volatile zone currently due to certain macroeconomic issues and geopolitical tensions prevailing. Therefore, it is prudent to follow a cautious approach while investing.
Note 1: Past performance is not a reliable indicator of future performance.
Note 2: The reference date for all price data, currency, technical indicators, support, and resistance levels is June 27, 2023. The reference data in this report has been partly sourced from REFINITIV.
Note 3: Investment decisions should be made depending on an individual's appetite for upside potential, risks, holding duration, and any previous holdings. An 'Exit' from the stock can be considered if the Target Price mentioned as per the Valuation and or the technical levels provided has been achieved and is subject to the factors discussed above.
Note 4: The report publishing date is as per the Pacific Time Zone.
Technical Indicators Defined: -
Support: A level at which the stock prices tend to find support if they are falling, and a downtrend may take a pause backed by demand or buying interest. Support 1 refers to the nearby support level for the stock and if the price breaches the level, then Support 2 may act as the crucial support level for the stock.
Resistance: A level at which the stock prices tend to find resistance when they are rising, and an uptrend may take a pause due to profit booking or selling interest. Resistance 1 refers to the nearby resistance level for the stock and if the price surpasses the level, then Resistance 2 may act as the crucial resistance level for the stock.
Stop-loss: It is a level to protect against further losses in case of unfavorable movement in the stock prices.
Kalkine Equities LLC provides general information about companies and their securities. The information contained in the reports, including any recommendations regarding the value of or transactions in any securities, does not take into account any of your investment objectives, financial situation or needs. Kalkine Equities LLC is not registered as an investment adviser in the U.S. with either the federal or state government. Before you make a decision about whether to invest in any securities, you should take into account your own objectives, financial situation and needs and seek independent financial advice. All information in our reports represents our views as at the date of publication and may change without notice.
Kalkine Media LLC, an affiliate of Kalkine Equities LLC, may have received, or be entitled to receive, financial consideration in connection with providing information about certain entity(s) covered on its website.
Past performance is not a reliable indicator of future performance.
 Please wait processing your request...