Section 1: Company Overview and Fundamentals
1.1 Company Overview:
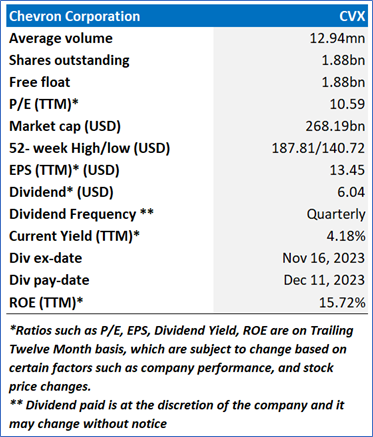
Chevron Corporation (NYSE: CVX) is an integrated energy company. The Company produces crude oil and natural gas; manufactures transportation fuels, lubricants, petrochemicals, and additives, and develops technologies that enhance its business and the industry.
Kalkine’s Dividend Income Report covers the Company Overview, Key positives & negatives, Investment summary, Key investment metrics, Top 10 shareholding, Business updates and insights into company recent financial results, Key Risks & Outlook, Price performance and technical summary, Target Price, and Recommendation on the stock.
Stock Performance:
1.2 The Key Positives, Negatives, and Investment summary


1.3 Top 10 shareholders:
The top 10 shareholders together form ~32.52% of the total shareholding, signifying diverse shareholding. The Vanguard Group, Inc., and State Street Global Advisors (US) are the biggest shareholders, holding the maximum stake in the company at ~8.57% and ~6.59%, respectively.

1.4 Consistent dividend payments with impressive dividend yield:
Chevron Corporation's Board of Directors has announced a quarterly dividend of USD1.51 per share, scheduled for payment on December 11, 2023, to all common stockholders listed on the corporate transfer records as of November 17, 2023. This dividend declaration is in line with Chevron's longstanding commitment to providing returns to its shareholders through regular and competitive dividend payments. With a history of consistent dividend payouts, Chevron has demonstrated its dedication to delivering value to investors and maintaining a reliable income stream over the years.
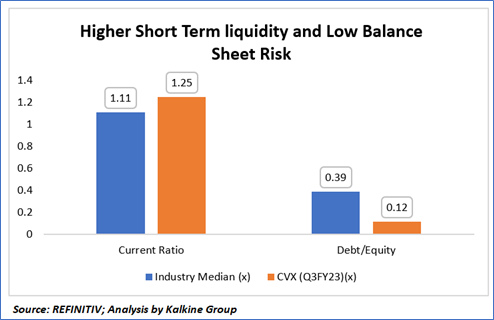
1.5 Key Metrics
When assessing financial metrics, Chevron Corporation (CVX) exhibits favorable figures in comparison to the industry median. As of Q3 FY23, CVX boasts a higher current ratio of 1.25, surpassing the industry median of 1.11. This indicates that Chevron has a healthier short-term liquidity position, suggesting its ability to meet its short-term obligations more efficiently. Moreover, in terms of debt management, CVX demonstrates a lower Debt/Equity ratio at 0.12, outperforming the industry median of 0.39. A lower Debt/Equity ratio implies that Chevron relies less on debt financing to support its operations, reflecting a more conservative and potentially less risky financial structure compared to the industry average. These metrics underscore Chevron's robust financial position and prudent financial management, contributing to its overall financial stability within the industry.
Section 2: Business Updates and Financial Highlights
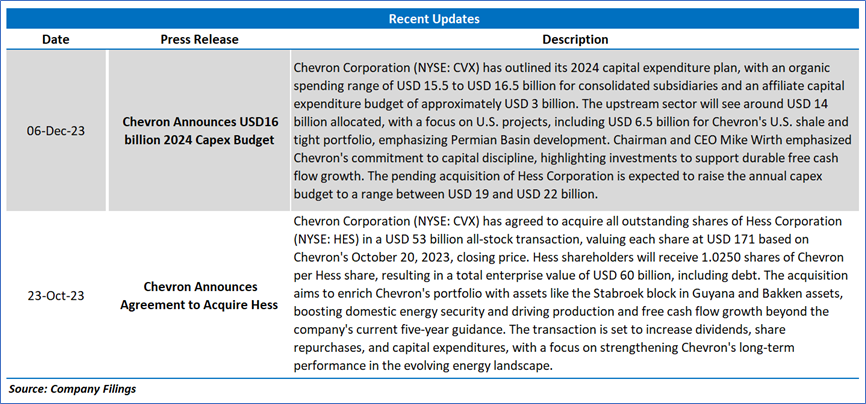
2.1 Recent Updates:
The below picture gives an overview of the recent updates:
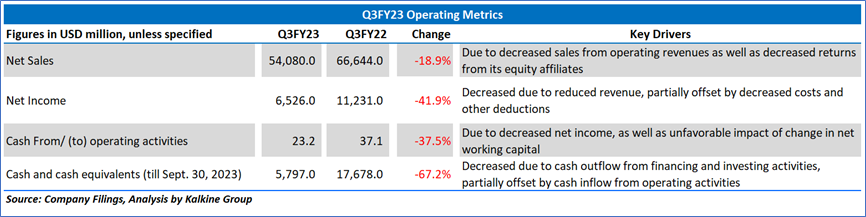
2.2 Insights of Q3FY23:
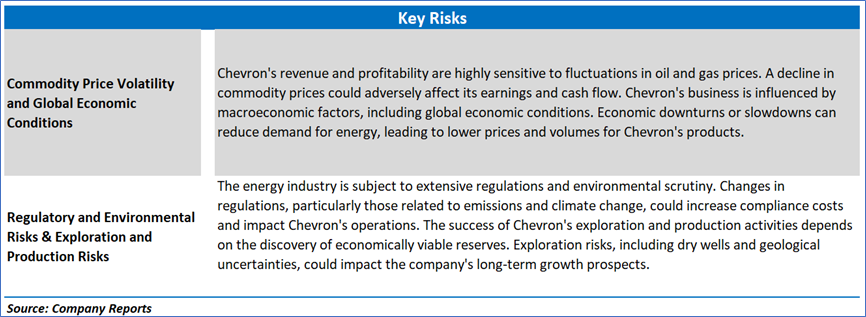
Section 3: Key Risks and Outlook:
Section 4: Stock Recommendation Summary:
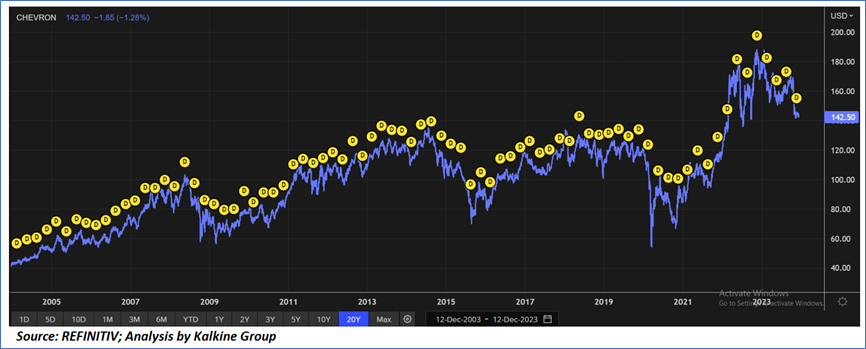
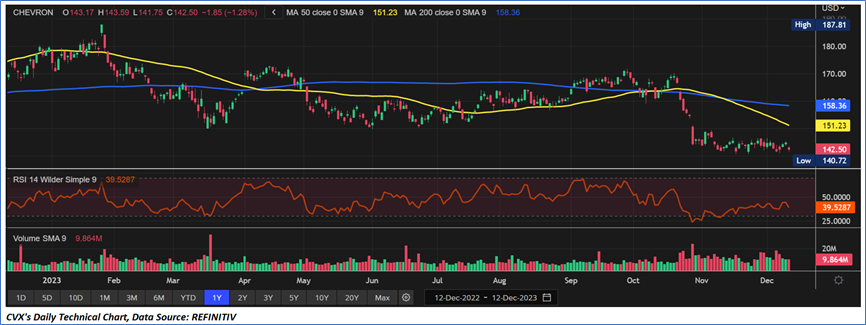
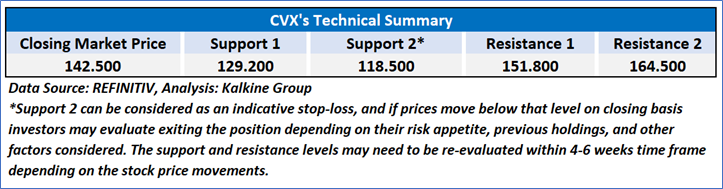
4.1 Price Performance and Technical Summary:
Stock Performance:
4.2 Fundamental Valuation
Valuation Methodology: Price/Earnings Multiple Based Relative Valuation

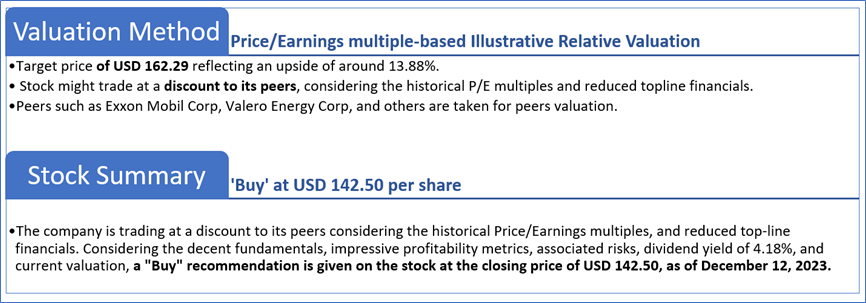
Markets are trading in a highly volatile zone currently due to certain macroeconomic issues and geopolitical tensions prevailing. Therefore, it is prudent to follow a cautious approach while investing.
Note 1: Past performance is not a reliable indicator of future performance.
Note 2: The reference date for all price data, currency, technical indicators, support, and resistance levels is December 12, 2023. The reference data in this report has been partly sourced from REFINITIV.
Note 3: Investment decisions should be made depending on an individual's appetite for upside potential, risks, holding duration, and any previous holdings. An 'Exit' from the stock can be considered if the Target Price mentioned as per the Valuation and or the technical levels provided has been achieved and is subject to the factors discussed above.
Note 4: The report publishing date is as per the Pacific Time Zone.
Technical Indicators Defined: -
Support: A level at which the stock prices tend to find support if they are falling, and a downtrend may take a pause backed by demand or buying interest. Support 1 refers to the nearby support level for the stock and if the price breaches the level, then Support 2 may act as the crucial support level for the stock.
Resistance: A level at which the stock prices tend to find resistance when they are rising, and an uptrend may take a pause due to profit booking or selling interest. Resistance 1 refers to the nearby resistance level for the stock and if the price surpasses the level, then Resistance 2 may act as the crucial resistance level for the stock.
Stop-loss: It is a level to protect against further losses in case of unfavorable movement in the stock prices.
Kalkine Equities LLC provides general information about companies and their securities. The information contained in the reports, including any recommendations regarding the value of or transactions in any securities, does not take into account any of your investment objectives, financial situation or needs. Kalkine Equities LLC is not registered as an investment adviser in the U.S. with either the federal or state government. Before you make a decision about whether to invest in any securities, you should take into account your own objectives, financial situation and needs and seek independent financial advice. All information in our reports represents our views as at the date of publication and may change without notice.
Kalkine Media LLC, an affiliate of Kalkine Equities LLC, may have received, or be entitled to receive, financial consideration in connection with providing information about certain entity(s) covered on its website.
Past performance is not a reliable indicator of future performance.
 Please wait processing your request...