
Section 1: Company Overview, Shariah Compliance Standards and Fundamentals
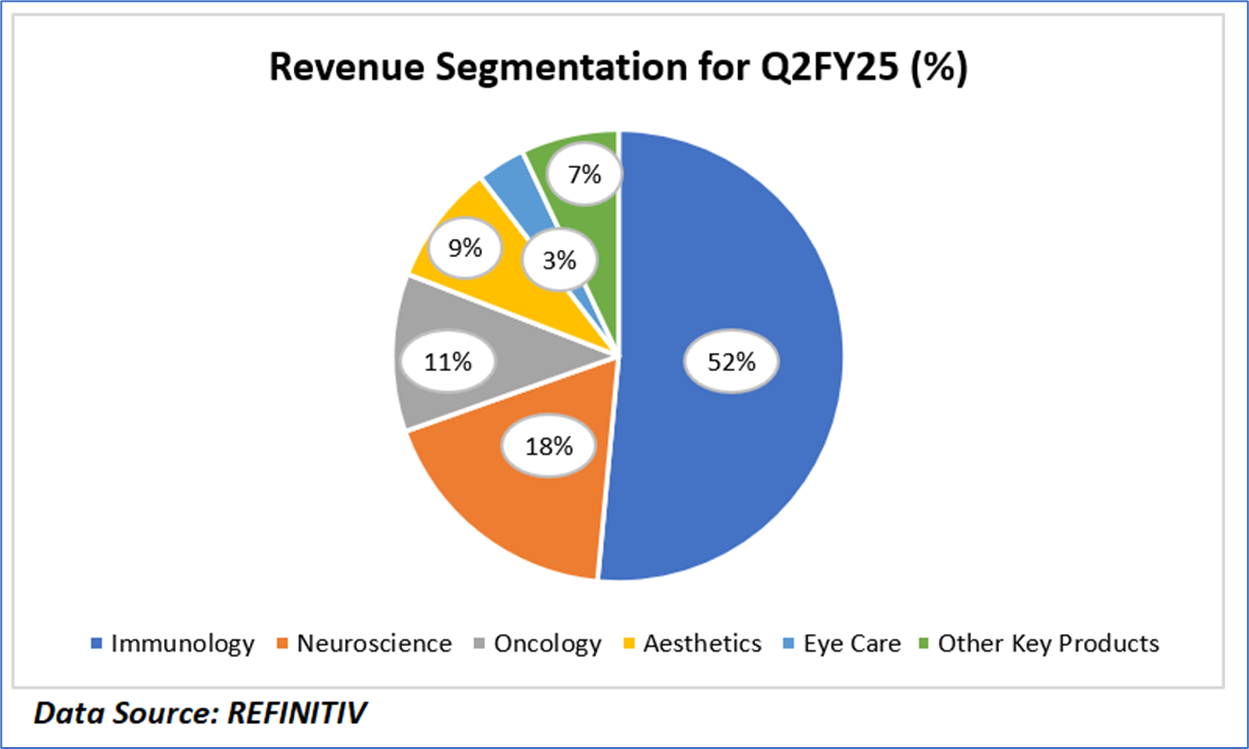
Section 1.1: AbbVie Inc. (NYSE: ABBV) is a global, diversified research-based biopharmaceutical company. The Company is engaged in research and development, manufacturing, commercialization and sale of medicines and therapies. Its product portfolio includes Immunology, Oncology, Aesthetics, Neuroscience, Eye Care and Other Key Products.
Kalkine’s ‘The Shariah Compliance Report’ covers the Investment Highlights, Shariah-compliance standards, Key Financial Metrics, Risks, and Technical Analysis along with the Valuation, Target Price, and Recommendation on the stock.
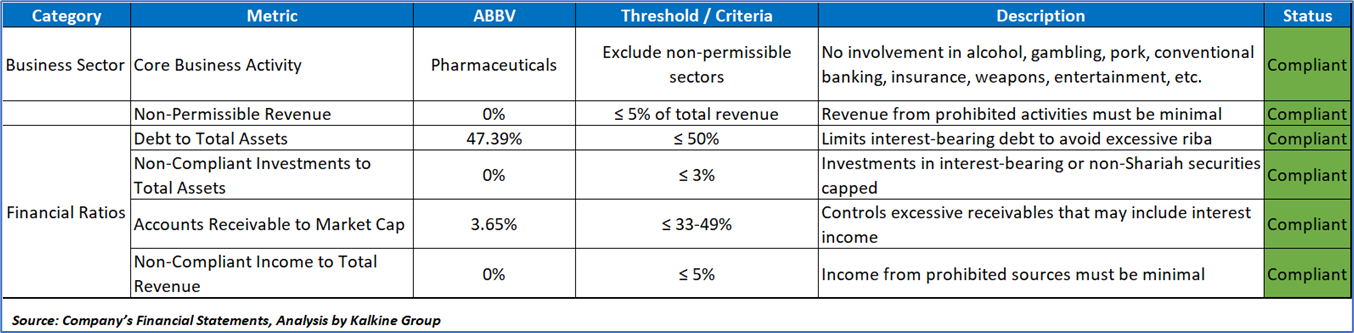
Section 1.2: What are the Key Metrics for Shariah Compliance to be Considered?
The Shariah Compliance Report aims to identify equities that align with Shariah and ethical principles, providing valuable insights on financial metrics, business activities and compliance with Islamic finance norms.
Key Shariah Screening Criteria and Thresholds

Shariah Metrics for AbbVie Inc (NYSE: ABBV)
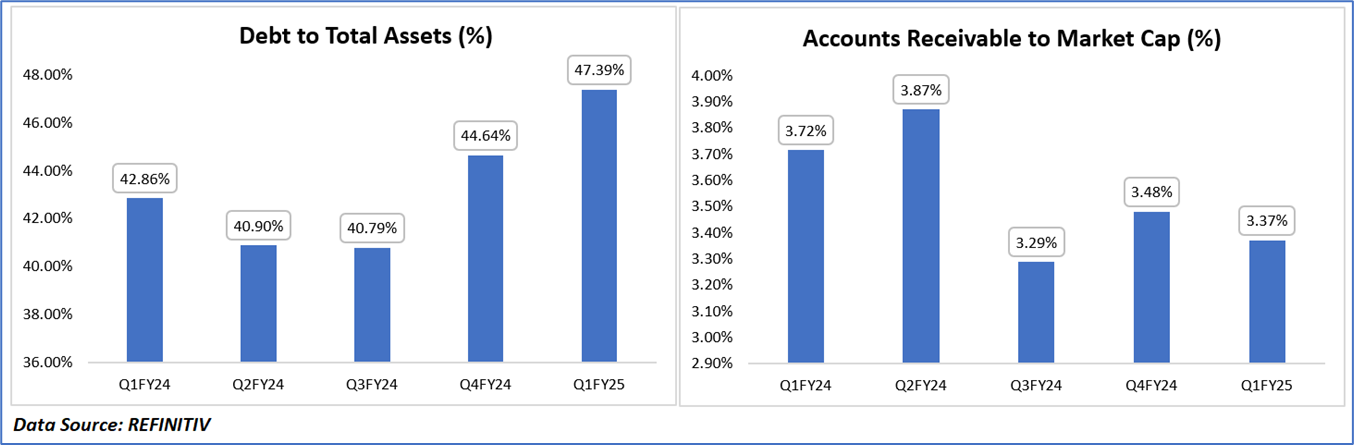
Revenue Segmentation of ABBV in Q2FY25 & Historical Compliance of Financial Ratios:
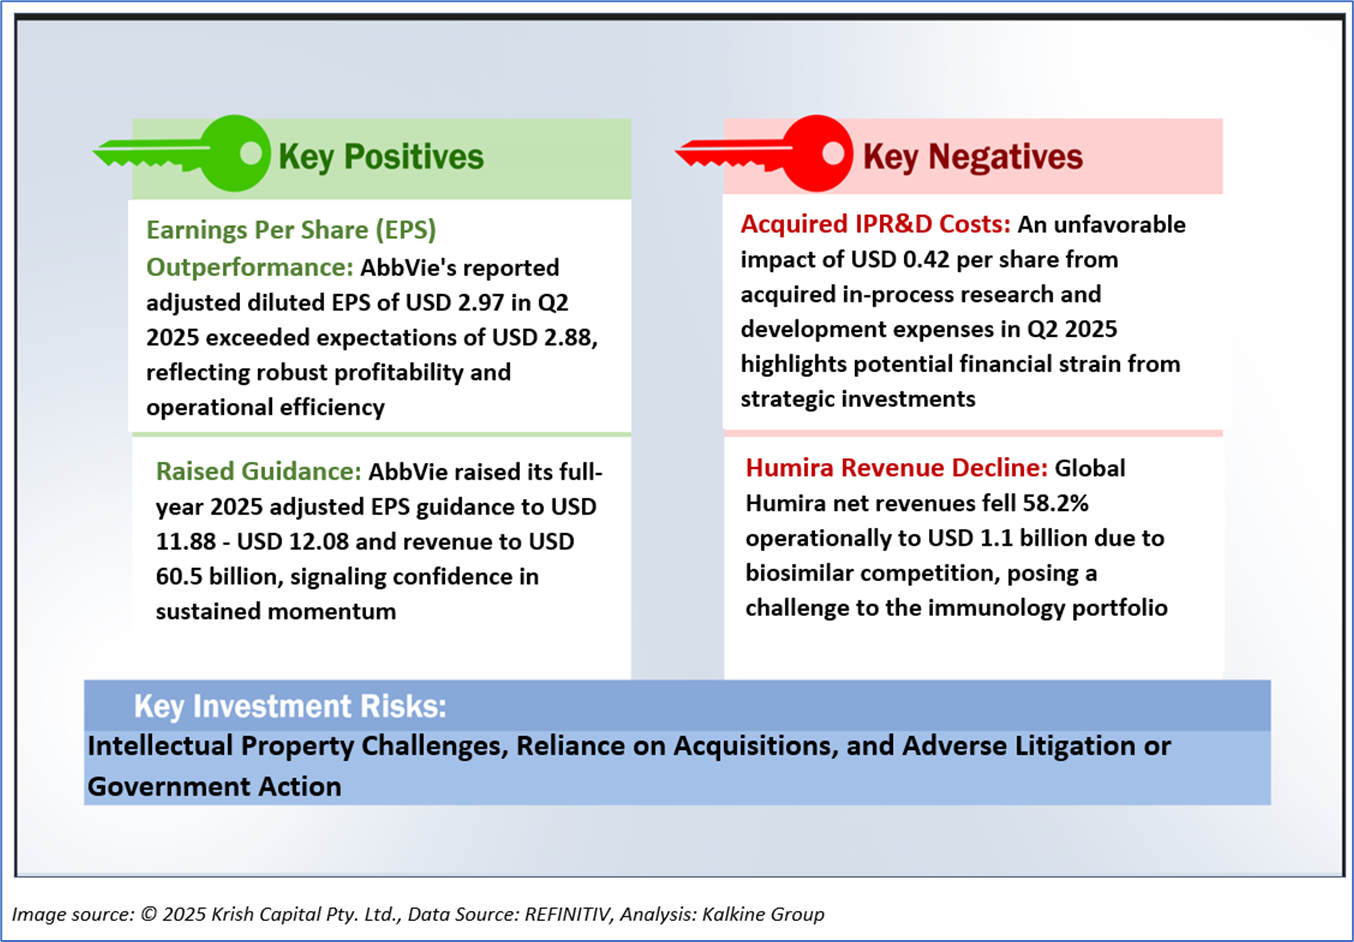
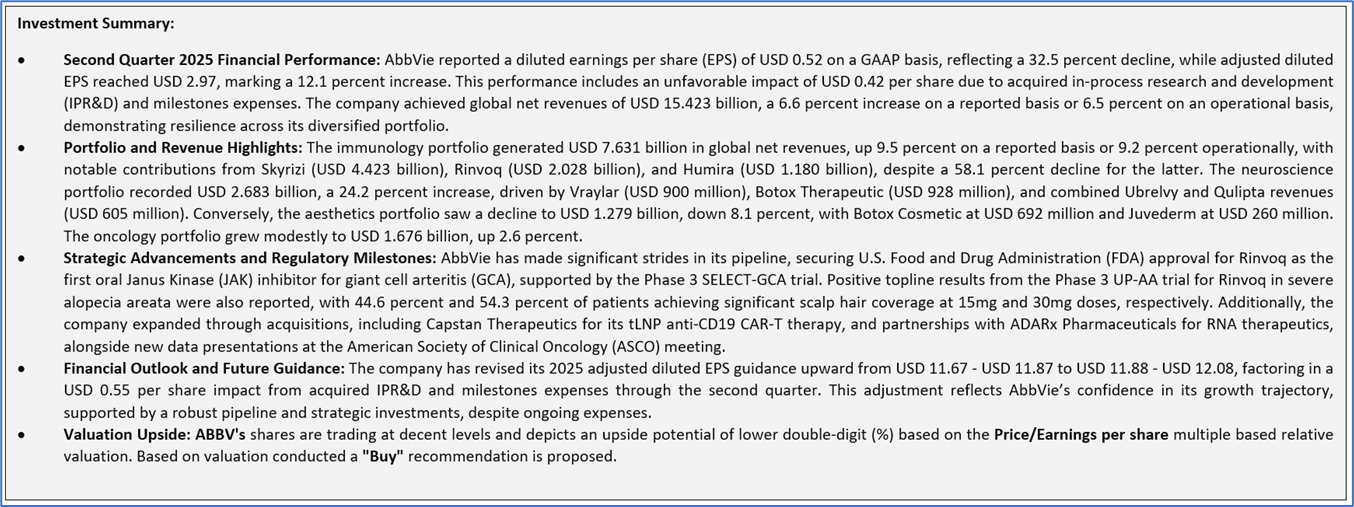
1.3 The Key Positives, Negatives, and Investment summary
1.4 Top 10 shareholders:
The top 10 shareholders together form ~31.17% of the total shareholding, signifying concentrated shareholding. The Vanguard Group, Inc., and BlackRock Institutional Trust Company, N.A. are the biggest shareholders, holding the maximum stake in the company at ~10.04% and ~5.15%, respectively.

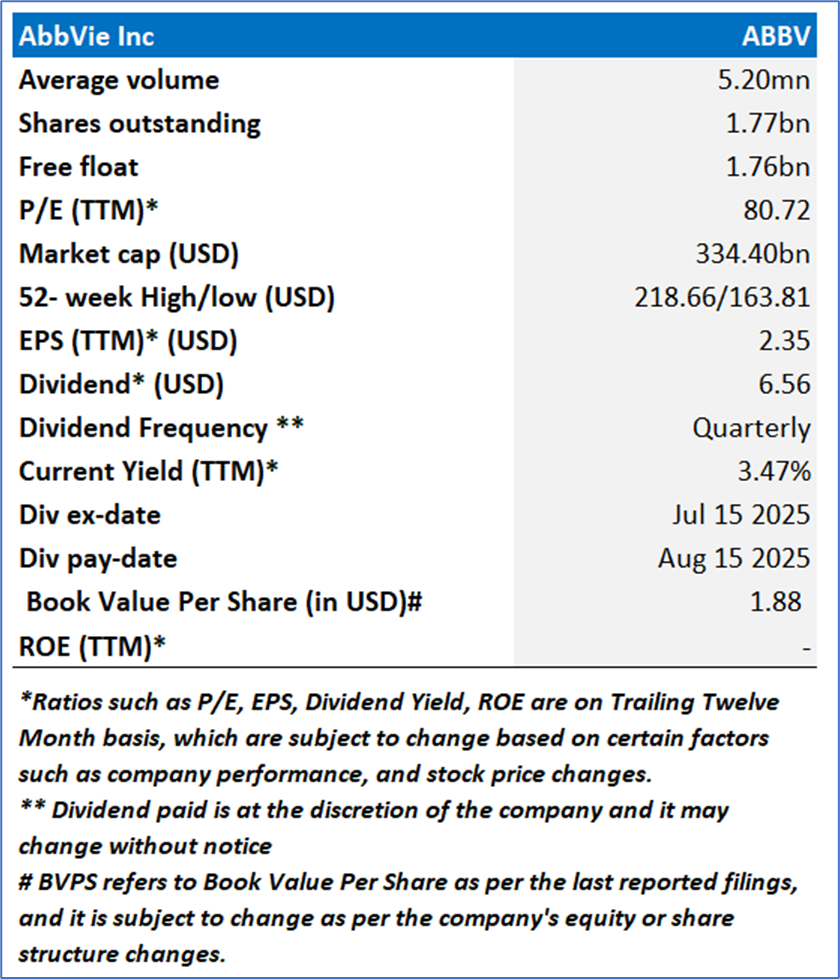
1.5 Key Metrics:
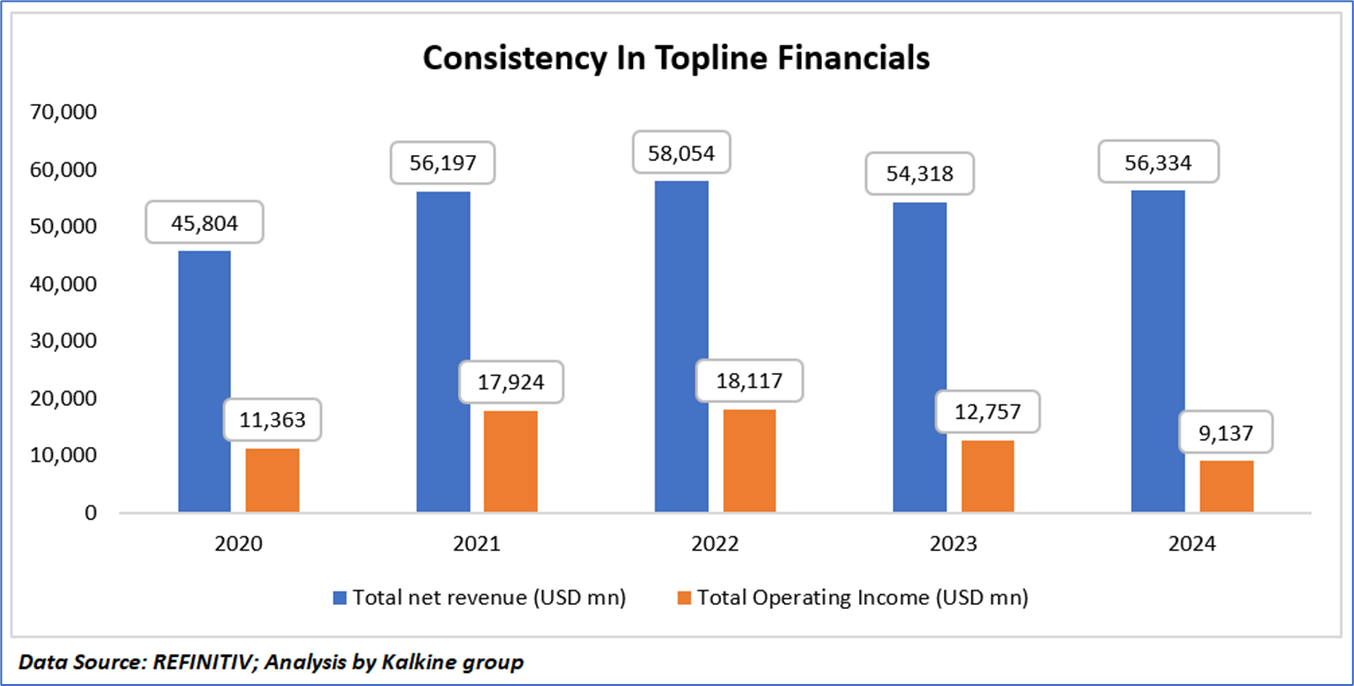
AbbVie (NYSE: ABBV) has demonstrated a varied financial performance from 2020 to 2024, with total net revenue increasing from USD 45,804 million in 2020 to a peak of USD 58,054 million in 2022, followed by a decline to USD 54,318 million in 2023, and a modest recovery to USD 56,334 million in 2024, reflecting resilience amidst market challenges and product lifecycle dynamics, particularly the impact of biosimilar competition on Humira. Total operating income exhibited significant growth from USD 11,363 million in 2020 to USD 18,117 million in 2022, driven by strong portfolio performance, but subsequently declined to USD 12,757 million in 2023 and further to USD 9,137 million in 2024, suggesting increased operational costs or investments, possibly related to research and development or strategic acquisitions, which may have offset revenue gains. This analysis indicates a robust revenue trajectory tempered by profitability pressures, underscoring the need for continued innovation and cost management to sustain long-term growth.
Section 2: Business Updates and Financial Highlights
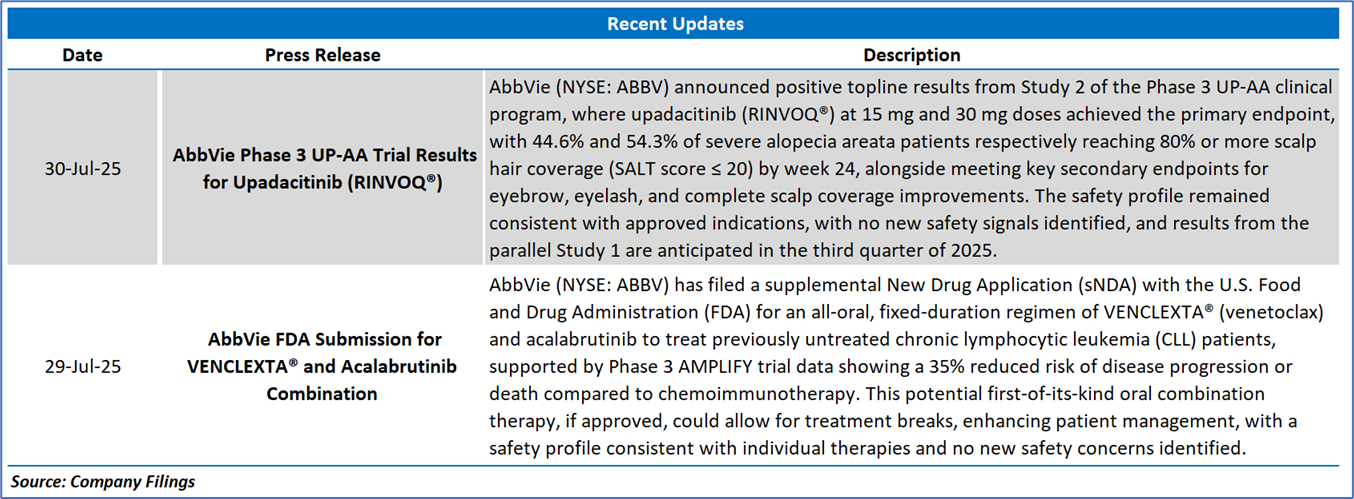
2.1 Recent Updates:
The below picture gives an overview of the recent updates:
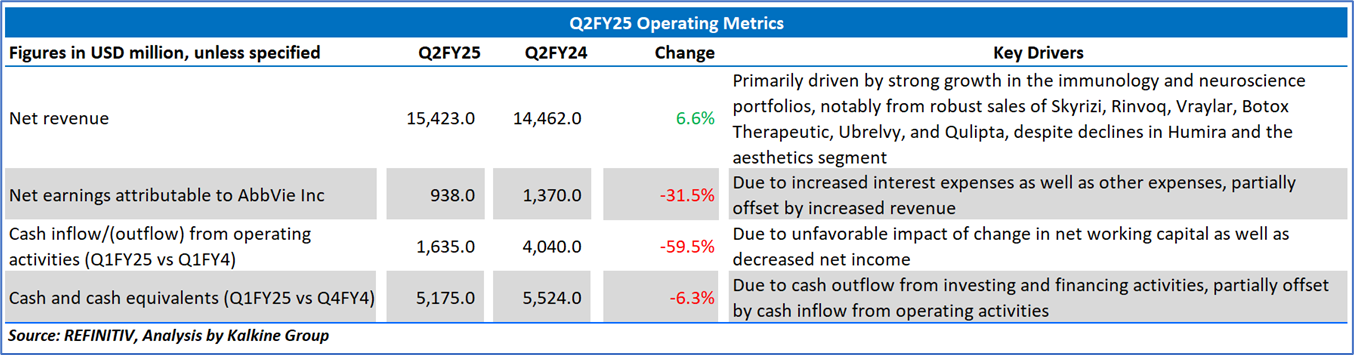
2.2 Insights of Q2FY25:
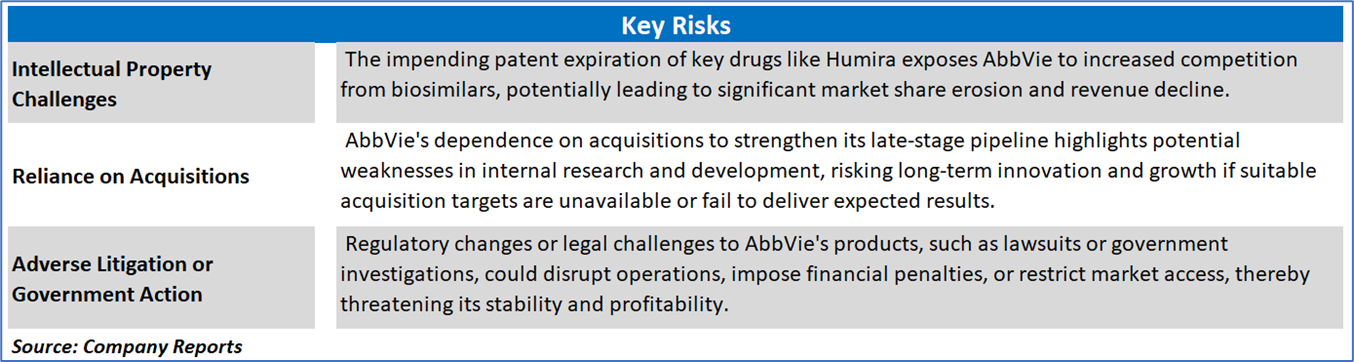
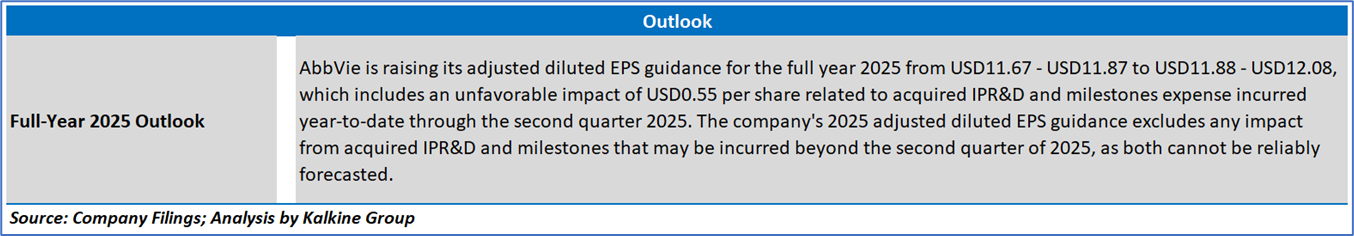
Section 3: Key Risks and Outlook:
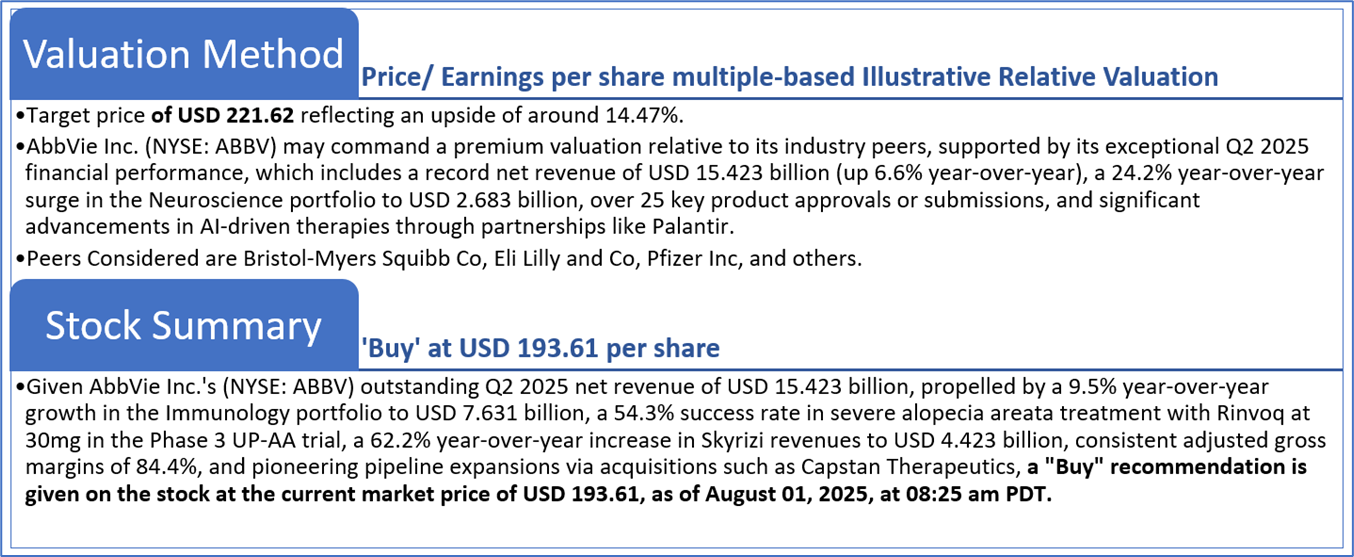
Section 4: Stock Recommendation Summary:
4.1 Technical Summary:
Price Performance:


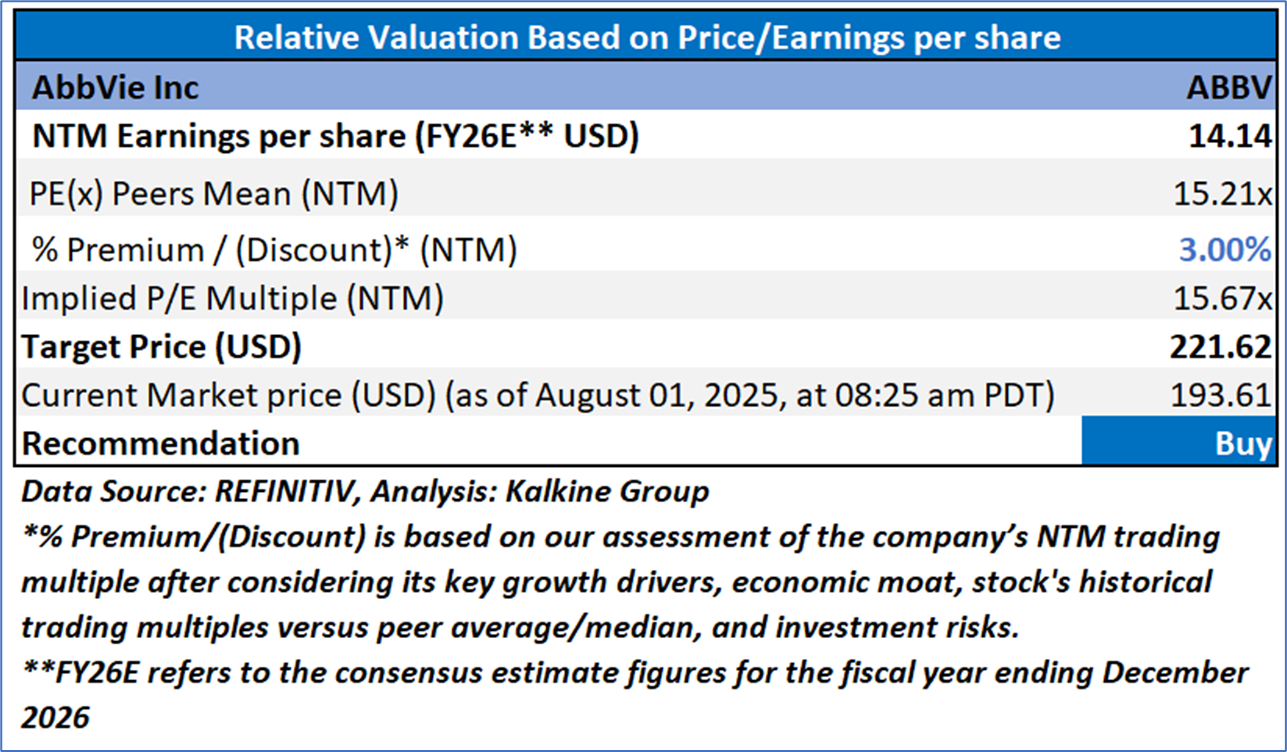
4.2 Fundamental Valuation
Valuation Methodology: Price/Earnings Per Share Multiple Based Relative Valuation
Markets are trading in a highly volatile zone currently due to certain macroeconomic issues and geopolitical tensions prevailing. Therefore, it is prudent to follow a cautious approach while investing.
Note 1: Past performance is not a reliable indicator of future performance.
Note 2: The reference date for all price data, currency, technical indicators, support, and resistance levels is August 01, 2025. The reference data in this report has been partly sourced from REFINITIV.
Note 3: Investment decisions should be made depending on an individual's appetite for upside potential, risks, holding duration, and any previous holdings. An 'Exit' from the stock can be considered if the Target Price mentioned as per the Valuation and or the technical levels provided have been achieved and is subject to the factors discussed above.
Note 4: The report publishing date is as per the Pacific Time Zone.
Technical Indicators Defined: -
Support: A level at which the stock prices tend to find support if they are falling, and a downtrend may take a pause backed by demand or buying interest. Support 1 refers to the nearby support level for the stock and if the price breaches the level, then Support 2 may act as the crucial support level for the stock.
Resistance: A level at which the stock prices tend to find resistance when they are rising, and an uptrend may take a pause due to profit booking or selling interest. Resistance 1 refers to the nearby resistance level for the stock and if the price surpasses the level, then Resistance 2 may act as the crucial resistance level for the stock.
Stop-loss: It is a level to protect against further losses in case of unfavorable movement in the stock prices.
Kalkine Equities LLC, with Delaware File Number 4697384, Foreign Qualification Registration in California File Number 202109211078, and Texas File Number 805521396, is authorized to provide general advice only. The information on https://kalkine.com/ does not take into account any of your investment objectives, financial situation or needs. You should consider the appropriateness of advice taking into account your own objectives, financial situation and needs and seek independent financial advice before making any financial decisions. The link to our Terms and Conditions and Privacy Policy has been provided for your reference. On the date of publishing the reports (mentioned on the website), employees and/or associates of Kalkine do not hold positions in any of the stocks covered on the website. These stocks can change any time and readers of the reports should not consider these stocks as advice or recommendations later.
Past performance is not a reliable indicator of future performance.
 Please wait processing your request...