What is Earnings Per Share?
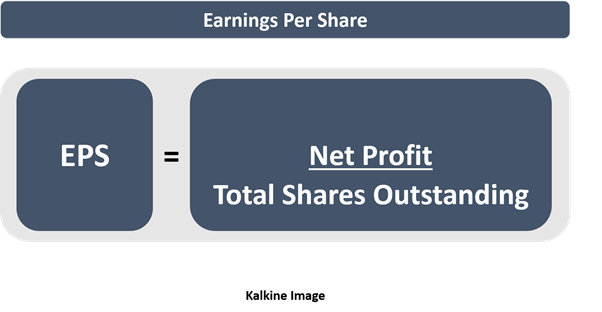
EPS is the per share profit by a business in a given period. While analysing a business financially, it serves as one of the basic tools. EPS is calculated by dividing profits by total shares outstanding for a given period.

EPS is reported on the profit and loss statement of an enterprise and works as a denominator for beloved price-to-earnings ratio (P/E ratio), used not just by novice investors but also fund managers. A business is required to generate sustainable earnings in its life cycle, and earnings or profits are essentially among major intend of a promotor.
To know more about P/E ratio read: Understanding Price-Earnings Ratio
But reported earnings of a business will likely differ from actual cash earnings because devising profits mandate broader accounting standards and principles to provide a fair picture of an enterprise. EPS, therefore, becomes imperative for investors, market participants and other users of information.
EPS estimates are circulated by sell-side analysts to market participants. Financial Modelling is applied to arrive at the EPS estimates of future financial years, semi-annual periods or quarterly, depending on the reporting adopted by the firm.
Analyst estimates are then collected by market data providers like Reuters, Bloomberg, IRESS to provide a consensus view of analysts on the business and its financials, including revenue, operating expense, earnings before interest and tax, profit after tax, EPS.
Market estimates enable participants to evaluate the expectations of sell-side analysts from a particular company, sector or even index. Analyst estimates also indicate the divergence between an individual’s expectations and collective expectations of analysts that are tracking the company.
An individual can, therefore, determine whether the stock of the company is undervalued or overpriced by the market against hi one’s fair value estimates that are based on the expectations from the company.
More on EPS read: What Do We Mean By Earnings Per Share (EPS)?
How to calculate EPS?
Although general formula considers total shares outstanding in the denominator, it is preferred to use weighted average shares outstanding over a period because companies issue new shares, buyback or cancel shares.

Net Income is the profit reported by a business after incurring income tax. It is also called as Net Profit After Tax.
Dividends on Preferred Shares are paid to preferential shareholders because they have first right over the income of a business, but preferred shares don’t have voting rights like common shareholders or ordinary shareholders.
Weighted Average Shares Outstanding is calculated after incorporating changes in number of shares during a period, and using weighted average shares outstanding provides a fair financial position of a company.
Basic V/S Diluted EPS
Diluted EPS is calculated after adding the weighted average number of shares that would be issued after the conversion of dilutive shares to weighted average shares outstanding. Dilutions can include share rights, performance rights, convertible bonds etc.
Whereas Basic EPS is calculated by taking weighted average shares outstanding that incorporate changes to number of shares outstanding such as buyback, new issues etc.
What is Adjusted-EPS?
In a financial period, firms may incur one-time expenses or transactions that are not usual in the normal course of business. The objective of adjusted EPS is to arrive at a fair picture of the business, especially for financial forecasting.
Extraordinary items are excluding from EPS to arrive at adjusted EPS figure. These items can include gain on sale of assets, loss on sale of assets, merger costs, capital raising costs, integration expenses etc.
What is Normalised EPS?
Normalised EPS is calculated to arrive at an EPS figure, which embeds the fluctuations in income due to business cycles or industry cycles. It also includes adjustments made for calculation of adjusted EPS such as one-time gains or losses.
Normalised EPS is a useful measure for companies that are sensitive to economic cycles or changes in the business environment. By smoothening out the fluctuations, it provides a fair picture of the business.
If a company has reported high normalised earnings over periods, it is considered that the company is less sensitive to changes in business cycles because of its stable revenues and income during the periods.
EPS and Price-to-earnings ratio
Calculation of price-to-earnings ratio requires EPS as denominator and price of the stock as numerator. EPS therefore becomes a very important financial metric for investors. EPS and price data also allows participants to compare the historical trends of the P/E ratio with the current market scenario and P/E ratio of the stock.
How can increase grow EPS?
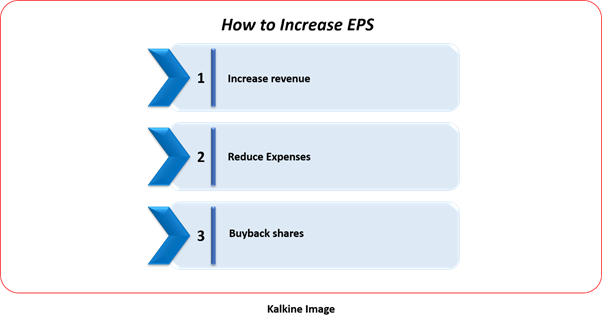
Businesses can increase EPS by focusing on increasing their revenue, by improving operational efficiencies either by deploying technology to reduce cost, or negotiate better prices with vendors, operate in tax efficient manner, etc. Businesses can also improve EPS by undertaking corporate action such as buying back of shares.
Read: Pros and cons of buybacks – Story of 5 Popular Stocks including Aurizon

Good read: Every Doubt You Have On Earnings Per Share- Explained Right Here!
 US
US  AU
AU UK
UK CA
CA NZ
NZ Please wait processing your request...