Cost of capital is defined as the rate of return required by the provider of capital, i.e., debt providers, bondholders or bond investors and equity investors for inheriting business risk.
Cost of capital could also be defined as the opportunity cost of capital for the capital providers.
A company has several ways of raising capital for the business, including issuing equity and debt, and each source utilised by a company to raise capital has a cost, i.e., the required rate of return by owners and bondholders, which becomes the component cost of capital.
In general, the cost of capital of a company is the minimum rate of return expected by investors for taking average-risk investment in a company.
Components of Cost of Capital
There are many ways in which a company could raise capital for the business; however, only three major capital sources are important for calculating the average cost of capital or average required return on capital deployed by investors.
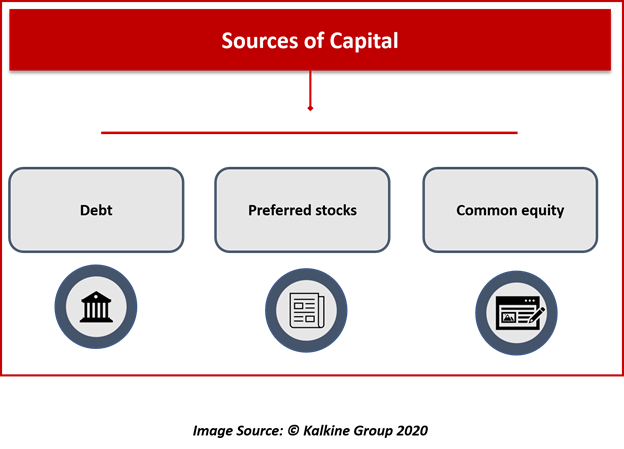
- Debt
- Preferred stocks
- Common equity
When we deal with the cost of capital in the sense of capital budgting security analysis, and investment decision, we basically deal with the marginal cost of capital.
Marginal Cost of Capital and Capital Budgeting Decisions
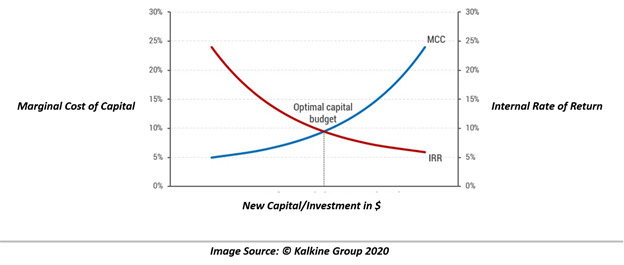
The marginal cost of capital (or MCC) is defined as the cost to raise one additional unit of new capital from each source of capital, i.e., debt, preferred stocks, and common equity.
Furthermore, the marginal cost of capital is positively related to the new capital raised, i.e., the marginal cost of capital increases as additional capital is raised.
As per microeconomics, it is generally believed that marginal productivity declines with each additional unit increase after an initial period of a rise.
Likewise, as per capital budgeting, it is usually believed that returns decline with additional investment.
Thus, in the capital budgeting process, the marginal cost of capital slopes upward and the investment opportunity schedule slopes downward. The point where the marginal cost of capital intersects the investment opportunity schedule is taken as optimal capital budget.
Weighted Average Cost of Capital And Capital Budgeting Decisions
The weighted average cost of capital (or WACC) is defined as the marginal cost of capital for raising additional units of fund from each of the three major sources, i.e., debt, preferred stocks, and common equity.
Though WACC might look similar to MCC, they both differ in a sense that WACC uses weights or proportion of capital source being used.
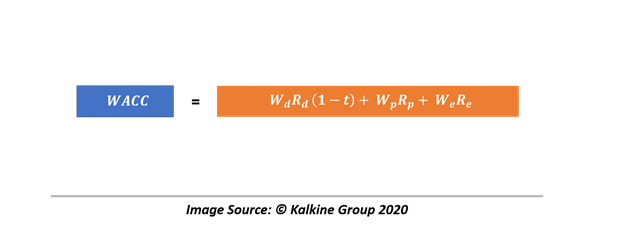
Where
Wd = proportion of debt
Rd = the before-tax marginal cost of debt
T = tax rate
Wp = proportion of preferred stocks
Rp = the marginal cost of preferred stocks
We = proportion of common equity
Re = the marginal cost of common equity
Once adjusted, the WACC and MCC, which correspond to the average risk of a company, plays a central role in capital budgeting decision.
In capital budgeting decisions, corporate finance analysts generally use WACC as the discount rate for the net present value (or NPV) calculation to reach the investment decision, and once WACC is used as the discount rate, it assumes that
- The project under consideration has the same risk as to the average risk project of a company.
- The project would maintain the targeted capital structure throughout its useful life.
Which often serves as the potential drawback for using WACC as the discount rate of NPV calculation as target capital structure do change with time, and a project may not necessarily have average risk as other projects of a company.
Calculating Cost of Capital for Different Sources
- Cost of Debt
The cost of debt is typically defined as the cost of debt financing, i.e., bond issue or a bank loan. While there are many ways to estimate the cost of debt, depending upon the type of debt instrument being used, the two major methods are as below:
Yield-to-Maturity Approach
Yield-to-maturity (or YTM) is basically the annual return an investor earns on a bond for holding it to maturity.
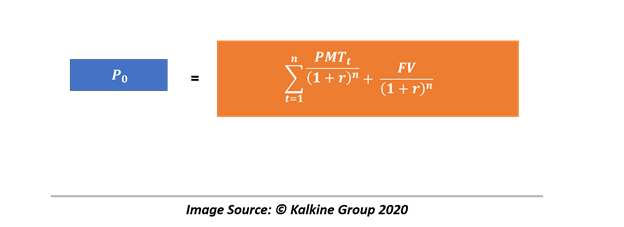
Where P0 = current market price
PMTt = interest payment per period
r = yield to maturity
n = number of periods until maturity
FV = maturity value
Debt-Rating Approach
This approach is used when there is no reliable market price available for a company’s debt, by using the YTM on comparably rated bonds for maturities matching the target’s company bond maturity. The approach uses the matrix-pricing method to estimate the before-tax cost of the target’s company debt.
Cost of Preferred Stock
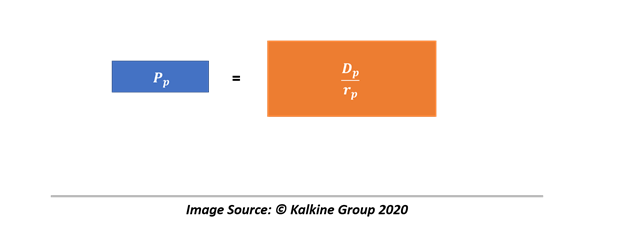
The cost of preferred stock is relatively easy to calculate as compared to other sources, and in the case of nonconvertible, noncallable preferred stock with a fixed preferred dividend, the cost could be calculated as below:
Where
Pp = current preferred stock price per share
Dp = preferred stock dividend per share
rp = the cost of preferred stock
While calculating the cost of simple preferred stock is easy, calculating the same for stocks with options such as call option, convertible feature, could be a troublesome task and requires a lot of adjustment to features of the preferred stock.
- Cost of Common Equity
Cost of equity could be estimated by using multiple methods with each having its own advantages and drawbacks. Some of the popular methods of doing the same are as below:
Capital Asset Pricing Model
Capital Asset Pricing Model (or CAPM) is one of the widely used models for estimating the cost of equity. The model takes the basic relationship of stock’s expected market return with the expected required return of and the risk-free rate into consideration to estimate the cost.
Gordon-Growth Model
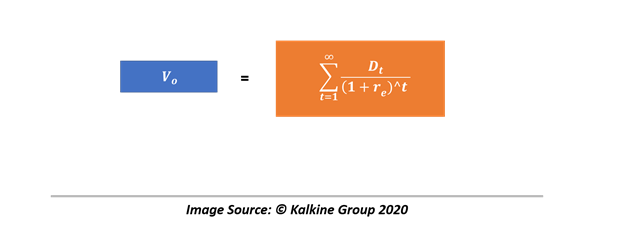
The model believes that the intrinsic value of a stock is the discounted value of all the expected future dividends or is the present value of all expected cash flow from stock in the face of dividend.
Where,
V0 = intrinsic value
Dt = dividend at the end of the period
re = cost of equity
Furthermore, based upon Gordon’s constant growth, the formula could be further modified to calculate re as below
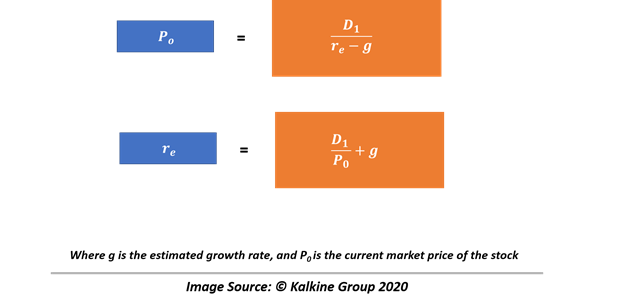
Also, g = (1 – D/EPS) ROE
Where (1 – D) is the retention rate, and ROE is Return on Equity.
 US
US  AU
AU UK
UK CA
CA NZ
NZ Please wait processing your request...