While conducting technical analysis, an analyst comes across many tools and indicators with which he/she can enhance his/her analytical skills. Trendline is once such tool which is one of the simplest yet most effective one out there with several applications like gauging the current trends or identifying support/resistance areas etc.
Trendlines can be used across the asset classes, and its applications are not limited to a single market or security.
One important aspect of the trendline is its time-independent nature, i.e. a trendline can be drawn on any time frame chart be it daily, weekly, monthly or even on intraday charts like 5 minute, 30 minute etc.
How to draw a trendline
Drawing a trendline is quite simple, but a few minor mistakes may lead one to draw a completely wrong trendline. The primary requirement for drawing a trendline is the existence of a trend without which its practically impossible to draw a trendline, an example of which is a sideways market or a range-bound market.
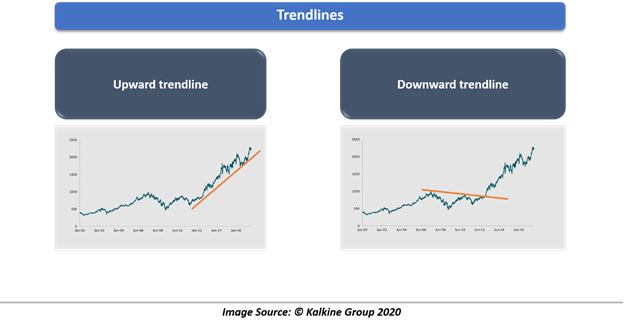
Now with two kinds of trends (uptrend and downtrend), there are two kinds trendlines to mark each of these.

- Upward trendline
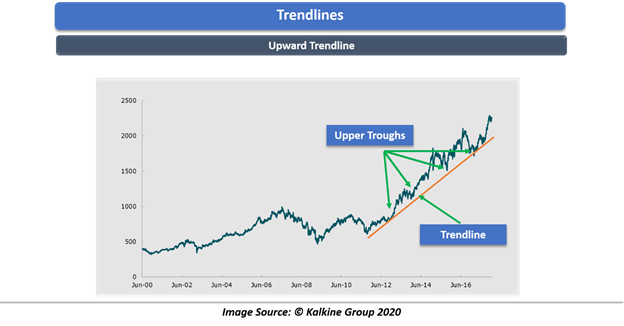
In an uptrend, where the stock is moving in a series of higher peak and high trough, a trendline is a straight line drawn upwards by connecting two successive lower troughs, preferably from the start of the trend.

- Downward trendline
In a downtrend, where the stock is moving in a series of lower peak and lower trough, a trendline is a straight line drawn downwards by connecting two successive lower peaks, preferably from the start of the trend.
After drawing a trendline, generally, it is extended into the future with the same angle of ascent or descent for the future projections of support and resistance levels.
Usage of a trendline
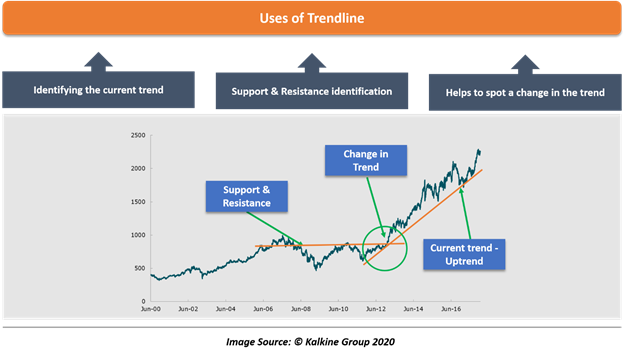
A trendline is a tool which is versatile in its usage. Depending upon the experience of the analyst, its uses can be increased for a wider scope. But primarily a trendline serves three basic purposes for which it is used widely.

- Identifying the current trend
As the saying goes “Trend is your friend”, identifying a trend is a major part of any form of technical analysis. Without knowing the underlying trend, any form of technical analysis is questionable. There are various methods used for trend identification, of which trendline is one.
By connecting two successive peaks (in a downtrend) and two successive troughs (in an uptrend) the current trend can be identified in a refined and objective manner. Apart from the current trend, extended trendline into the future can also help to gauge the future trend changes.
In an uptrend as long as the stock is trading above its upward trendline, it is deemed to be in an uptrend.
Same goes for the downtrend, as long as the stock trades below its downward trendline, it is said to be in a downtrend.
- Support & Resistance identification
One major role of trendlines is helping in identifying dynamic levels of support and resistance, which are hard to spot on a naked chart. It is said to be dynamic because these levels keep on changing as time goes by unlike the conventional horizontal zones, which can remain relevant even for years.
In an uptrend, whenever the stock retraces back, it is expected to find the support level around the area where the price and trendline meet in the future. As trendline is already extended into the future, these support levels can be marked beforehand. These support areas are the levels where one can enter to participate in the ongoing trend or to increase the existing position.
Same goes for the downtrend. Whenever the stock gives a rally in a downtrend, that rally is expected to get fizzle out near the level where the price touches its downtrend line. These resistance areas are the sweet spot to sell existing holdings for a better price or initiate a fresh short position.
- Helps to spot a change in the trend
Apart from gauging the current trend, a trendline also helps to identify the change in the trend. It is equally important if not more in order to carry out a complete analysis.
As long as the stock is trading above the trendline in an uptrend or below the trendline in a downtrend, the trend is considered to be intact. If the price penetrates across these trendlines, then the existence of the ongoing trend becomes questionable and is often an early warning of a trend reversal.
Higher the level of volume coming in at the time of breaking the trendline, stronger would be the confirmation of trend reversal. This could be a critical time to review the existing holdings when the trend reversal is taking place.
How trendline reverses roles
As discussed earlier, that trendlines act as a support level in an uptrend and resistance level in a downtrend, therefore the classical concept of support and resistance reversing roles after being breached applies to the trendlines also.
To put it simply, Once the upward trendline gets breached, which essentially means the breaking of a support level then this extended into the future is expected to act as a resistance level for the same security.
The opposite holds true for the downtrend line. Once the stock breaks above the resistance level, then that trendline is deemed to act as a support level in the future.
What defines the significance or strength of the trendline?
A trendline is just a tool in the arsenal of an analyst, but how and where to properly apply, the relevance of it etc. all comes with experience and depend on the skills and knowledge of the analyst. Still, there are a few parameters on which one can gauge the strength of the trendline, i.e. how strong the prevailing trend is.

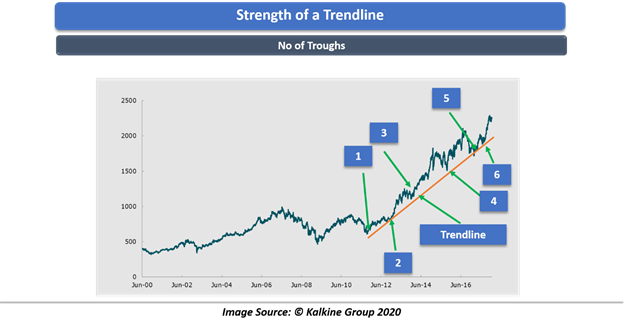
- Number of connecting peaks/troughs
One of the best ways to estimate the strength of a trendline is to see the number of peaks/troughs that are touching the trendline. Higher the number of these extreme points, higher would be the strength of the trendline.
To put it in simple words, a trendline connected with 4 peaks is deemed to be stronger than one with 2 connected peaks.
- The longevity of the trend
Longer the prevailing trend, stronger would we the trendline. Therefore, it is also noticed that very short term trendlines do not work much as the existence of the trend has not been established much.
 Please wait processing your request...