What do Solvency and Solvency Ratio mean?
Solvency refers to the ability of a company to fulfil or pay its long-term obligations, i.e., the obligations that are due for settlement after the period of one year.
Solvency ratios provide information concerning the debt of a company in comparison to its capital mix and the cushion of earnings and cash flow to cover any dues such as the interest payment on a debt, repayment of long-term obligations, and other fixed charges.
Analysts gather the information concerning the debt position of a company for several reasons, primarily to take a look at the leverage of a company to understand the risk and reward profile.
What Does the Solvency Ratio Reveal?
Solvency ratio focuses on the actual cash flow of a company rather than the net income by adding back the depreciation, amortisation and other non-cash expenses to determine the ability of a company to meet its debt commitments.
Solvency ratios generally measure the cash flow relative to all liabilities and hence focus on all obligations, i.e., short-term, and long-term; unlike liquidity ratios, which measure the short-term ability to pay the debt as they come due.
Generally, solvency ratios tend to vary from industry to industry; thus, on a standalone basis, it is not much of a great tool.
Therefore, it should be ideally used across multiple time frames or cross-sectional setting, i.e., a solvency ratio of a company should be either compared to its own past value or, it should be compared with the industry mean or average to gather more information.
Classification of Solvency Ratio
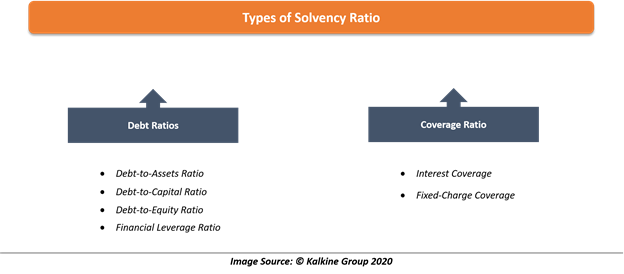
Broadly, solvency ratios can be divided into two categories, i.e., Debt ratios and Coverage ratios.
Debt ratios mainly focus on the balance sheet of a company to measure the amount of debt capital relative to equity capital.
Coverage ratios primarily narrow down on income statement to measure the ability of a company to cover its debt obligation.
Both debt ratios and coverage ratios are useful in assessing the solvency of a company; thus, they come handy in evaluating the quality of the bond and other debt instruments of the target company.
Types and Interpretation of Solvency Ratios

Debt Ratios
- Debt-to-Assets Ratio
This ratio basically measures the percentage of total debt of a company against its total assets to determine the level of assets financed by debt.

For example, a debt-to-assets ratio of 0.60 means 60 per cent of a company’s assets is debt-financed. Thus, a lower debt-to-assets ratio is generally desired as a high debt-to-assets ratio indicates higher debt, and higher financial risk and weaker solvency.
- Debt-to-Capital Ratio
This ratio measures the percentage of debt relative to the total capital of a company, i.e., debt and equity.

Just like the debt-to-assets ratio, a higher debt-to-capital ratio indicates more financial risk, and thus, is not desirable.
- Debt-to-Equity Ratio
The debt-to-equity ratio measures the percentage of debt capital against the equity capital. Just like other types of debt ratio, a higher debt-to-equity ratio reflects more financial risk; thus, it is often not desirable.
Furthermore, a debt-to-equity ratio of 1.0 suggests an equal proportion of debt and equity in the capital structure.
As stated above, analysts usually focus on debt to understand the solvency of a company, which is often highly linked to its financial leverage, i.e., more the fixed interest component in debt, higher would be the financial leverage so would be the risk.
- Financial Leverage Ratio
The financial leverage ratio a.k.a. leverage ratio measures the percentage of per unit of assets supported by per unit of the equity capital. Though the formula for calculating the financial leverage ratio incorporates total assets and total equity, many analysts tend to use the average of these two in the ratio as equity capital tend to change.

A financial leverage ratio of 2 means that each unit of equity supports two units of assets; thus, a lower ratio is generally desirable and reflects low risk.
Coverage Ratio
- Interest Coverage
The interest coverage simply measures the number of times a company’s EBIT could cover its interest expense; thus, this ratio is sometimes also referred to as “times interest earned”.

Higher interest coverage is ideally desirable as a high ratio indicates better solvency and ability of a company to meet its short-term debts such as bank debt, bonds, notes, as they come due from its operating earnings.
- Fixed-Charge Coverage
The fixed-charge coverage ratio relates fixed charges of a company to the cash flow generated, and it measures the number of times a company can cover its interest and lease payment though earnings, i.e., EBIT and lease received.

Just like the interest coverage ratio, a high fixed-charge coverage ratio is usually desirable as it reflects strong solvency.
Limitations of Solvency Ratio
Sometimes a higher solvency ratio fails to capture the true picture of the solvency position of a company as it tends to fluctuate considerably with the change in the debt of a company in its capital structure.
Therefore, at times, a company with low debt can show high solvency ratio, but if the company’s cash management practices are not robust, it might not be as solvent as indicated by its solvency ratio due to low debt.
For example, if a company’s accounts receivable is slow, it could eventually impact accounts payable, and, in turn, the solvency of the company.
 Please wait processing your request...