Return on Equity (ROE) is a popular financial metric used in assessing investment decisions. It tells you how much income the business is generating relative to shareholders’ equity. Investors use ROE to evaluate capital allocation decisions of firms. Companies with high ROEs tend to get higher valuation as compared to companies with lower ROEs.
Read: Are These Businesses Benefiting From A Good Return On Equity Ratio? – CSL, MFG, AMC, LOV, SYD

Companies can increase ROE either by increasing net income, by improving sales and profitability, or by decreasing shareholders equity by share buybacks.
However, for management, it is not just about generating high Return on Equity but achieving an optimal level of capital structure and returns to complement sustainability. They can hit high ROEs by loading an unusual amount of debt at high intensity compared to equity and increase their sales.
Debt can manipulate ROEs and capital intensive businesses ought to have long debt cycles, therefore it is perennial to look at business models and take appropriate measures. Market participants also compare ROEs of comparable companies to get better answers to divergences.
Good read: Understanding Operating Leverage and Five Financial Stocks
Investors consider ROEs as one of the measures to evaluate the performance of a bank. The spread between ROEs and banks cost of equity has served as an indicator of profitability for market participants. Besides, the benchmark ROEs for banks is dependent on business cycle, time period, and interest-rates.

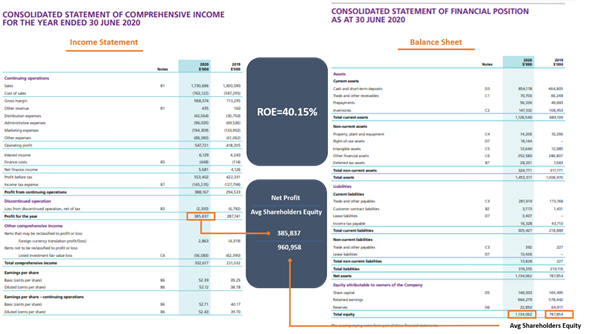
The A2 Milk Company Limited ROE Calculation, Image Kalkine (Data Source: 2020 Annual Report)
Net Income or Net Profit After Tax is given in the income statement of the company, and shareholders’ equity is reported in the balance sheet. Shareholders’ equity is taken as an average of beginning and ended. Should there be a large equity issue or buyback of similar scale, the ending amount of shareholders’ equity will give a better picture.
What are the limitations of using ROE?
Debt: Return on Equity is calculated without incorporating the debt in the balance sheet, meaning that the increase in net income is perhaps driven by debt funding as well. Even the companies with massive debt and relatively lower equity capital can boast high ROEs. A massive debt could be a problem for businesses, and a high ROE may give a false picture. Companies with high debt to equity ratio could report optically high ROE figures.
Depreciation: Depreciation is an expense that is recorded in the income statement of the company. It is incurred on the assets held by the business like plant and machinery, factory, trucks. A business in a growth stage can have addition of large assets, which would result in lower-income over the future due to increased depreciation.
Write downs: Assets of the company are also valued to determine any changes to the fair value of assets. The companies charge impairments to assets when current valuation is lower than the previously reported amount, which lowers assets value booked on the balance sheet.
Buybacks: Companies can also show better ROEs after buying back a lot of shares of the company, which reduces the shareholders’ equity. A lower amount of shareholders’ capital denotes that Return on Equity must have been higher.
Profits: Business with inconsistent profit-making ability lower the shareholders’ equity as loss are recorded as a retained loss in the balance sheet. After a period of losses, the deterioration in shareholders’ equity can cause ROE to be extremely high when a company swings back into profits.
Comparing two businesses within same industry with different capital structure becomes a challenge. Thus, analysts also use other ratios such as ROCE – Return on Capital Employed.
What is DuPont Model?
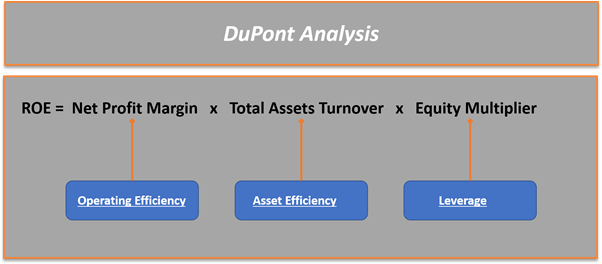
DuPont, a chemical company, introduced a method to calculate ROE and broke the equation into three parts: asset efficiency, leverage and operating efficiency. The method has three separate calculation of Net Profit Margin, Total Asset Turnover and Equity Multiplier.

Net Profit Margin allows testing the operating efficiency by calculating the net profit relative to the net sales in percentage terms. Total assets turnover helps to determine the asset efficiency by dividing sales by total assets. Equity Multiplier is determined by dividing Total Assets by Common Equity, representing financial leverage.
Read: Return on Assets
ROE = Net Profit Margin x Total Assets Turnover x Equity Multiplier
Where,
Net Profit Margin = Net Profit/Sales
Total Asset Turnover = Sales/ Total Assets
Equity Multiplier = Total Assets/Common Equity
A high ROE driven by an improvement in Net Profit Margin and Asset Turnover signals a positive sign for the business, but a rise in equity multiplier may indicate that business is taking further risks. When a business has sustainable leverage similar to its industry, it shows efficient management of capital sources.
Even if the increase in Return on Equity is driven by leverage along with deterioration in other parameters, it would indicate that business has maintained its ROE largely due to an increase in leverage.
5-Step DuPont Model
A five-step DuPont Model is a further extension of the basic DuPont model. This model argues that an increase in leverage may not always mean an increase in ROE. It was created to further segregate the net profit margin, allowing to assess the impact of interest payments of debt on net profit margins.
ROE = (Tax Burden) x (Interest Burden) x (Operating Margin) x (Asset `Turnover) x (Equity Multiplier)
Where,
Tax Burden = Net Income/EBT
Interest Burden = Earnings Before Taxes/Earnings Before Interest & Taxes
Operating Income Margin = EBIT/Sales
Asset Turnover = Sales/Total Assets
Equity Multiplier = Total Assets/Shareholders’ Equity
 Please wait processing your request...