What is R-Squared?
R-Squared (R2) is a statistical tool that explains how much variation is described by an independent variable in a regression model. While co-relation tells about the strength of the relationship between a dependent variable & an independent variable, R-squared describes the degree to which the variance of a variable explains another variable’s variance.
In investing, R-squared signifies the percentage of a fund or security's movement that the benchmark index movements can describe.
R-Squared Formula
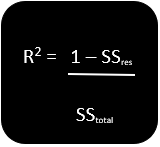
The formula for R-squared is:

SSres is the sum of residual or the error
SStotal is the sum of average total
R2 is the goodness of best fit line.
Explanation of the formula

Copyright © 2021 Kalkine Media Pty Ltd.
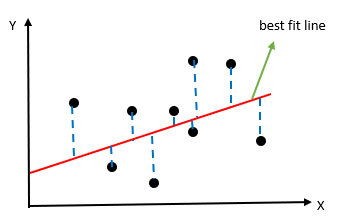
In the above graph, we see two axes X and Y. The black dots are the observed data. Using regression equation, we plot the best fit line based on the expected value. The blue dotted line shows how far is the actual value away from our predicted value. This difference between the actual value & the projected value would help us find SSres or the error value. Once we get the difference of all the actual data points and our predicted values, we would square the difference and add all the values.
Step 1) SSres = ∑(y-y’)2, where y’ is the predicted value and y is the actual value
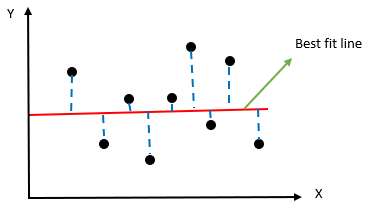
Next, we have to find the value of SStotal, which is the sum of average total. To get this value, we subtract the actual value from the mean of all the values.

Copyright © 2021 Kalkine Media Pty Ltd.
Step 2) SStotal = ∑(y-yavg)2, where yavg is the predicted value and y is the actual value
After getting the value of SSres and SStotal, we equate the value to the R2 formula to get a value. After solving the equation, we would get the value between 0 and 1. The more is the value close to 1, the line is best fitted to the model.
In case the SSres value is above the SStotal value, we get the negative value of R2. If this happens, then we can say that the model you have designed is a waste model.
What does R-Squared say?
As highlighted above, the value of R2 ranges from 0 to 1 or between 0% to 100%. The closer we are to 100%, the more is the line fitted best to the model. Let’s consider an example where we want to study the movement of a particular security using R2. After calculating R2, if we find that the value is 100%, it means that all the movement of a particular security is explained entirely by the index movement.
If the R-squared value of a security is 85% and above, we say that the security is in line with its index. However, the R-squared value of a security below 70% indicates that it is not following the market index.
Adjusted R-Squared
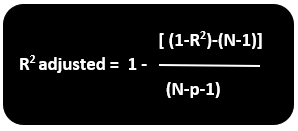
Adjusted R-Squared is the modified version of R-Squared that adjusts for predictors that are not significant to the regression model. Adjusted R-Squared sees whether the additional input data is contributing to the model or not.

R2 = Sample R square
P= number of predictors
N= sample size
Explanation of Adjusted R-Squared
Suppose we increase the number of independent variables or predictors to the regression model line. In that case, there are chances that the R-squared value increases and gives the user a provide user with an unwanted high R-squared value. It provides the user with the impression that the model which he/she has prepared is the best. However, the case might not be so.
Adjusted R-squared determines how reliable is the correlation between the variable and how much it is determined with the inclusion of the more independent variable.
How does Adjusted R-squared penalize you?
Both R-Squared and adjusted R-Squared give the user an idea about the number of data points within the regression equation. R-squared it assumes that each independent variable explains the variations in the dependent variable. However, Adjusted R-Squared tells the user about the percentage variation by those independent variables that affect the dependent variable.
Adjusted R-Squared penalizes the user for including those independent variables that do not fit the model. Users generally include multiple data in anticipation of getting better results. However, how much the data is significant, one cannot assure. It might be possible that the significance is just by chance. Here, Adjusted R-Squared's use would compensate for this by penalizing the user for including additional variables.
Generally, the value of R2 is positive. However, it could be negative as well if the value of R2 is zero. After adjustment, it might be possible that the value goes below zero and provide a negative value, thus, giving an indication that the model is a poor fit for the data.
 Please wait processing your request...