What is operating leverage?
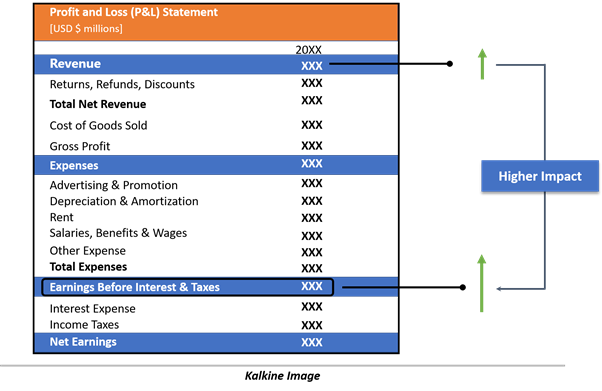
Operating leverage is a measure to evaluate the transition of top-line movement into bottom-line change. It essentially measures the change in operating profits as a function of change in sales. Operating profit is alternatively referred to as Earnings Before Interest & Taxes (EBIT).
High operating leverage means when a slight increase/decrease in sales for business results in even higher/lower increase in operating profits. Similarly, operating leverage is low when an increase in sales results in almost no or a slight increase in operating profits.

It specifies the degree to which firms incur the mix of fixed and variable costs. Fixed costs are incurred one time and remain same irrespective of change in volume, while variable costs change alongside a change in volumes.
In an effort to improving operating leverage, the company would intend to substitute its variable costs with fixed costs, thus the growth rate of earnings will be relatively higher compared to the growth rate of revenue.
But the company will be required to break-even to see operating leverage. Since variable costs are decreased, the contribution to the profits from each unit would be more than earlier.
With high operating leverage, the production volumes should increase to cover the fixed costs, and firms with low output levels may not benefit from the operating leverage. Capital intensive businesses like manufacturing firms have higher fixed costs, and operating leverage becomes appropriate to evaluate such firms.
How to calculate operating leverage?
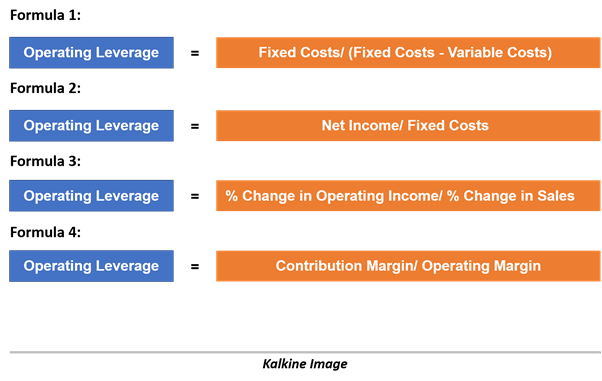
Since the information in financial statements is limited, there are several formulas to calculate operating leverage. Financial statements of a business would not necessarily provide the elements of cost.

It depends on the information in hand to use the formula. The audited financial statements of a company may not provide you with items likes fixed costs, variable cost or contribution margin. Therefore, formula 3 is an appropriate measure to calculate operating leverage, especially when the information is limited.
How to interpret operating leverage?
It is important that comparison of operating leverage should be an apple to apple comparison and certainly not apple to oranges. Moreover, similar businesses should be compared on the basis of operating leverage for an effective assessment.
Consider firm A has revenue of $2 billion, operating income of $400 million, and operating leverage of 2x. Firm B also has the same revenue and operating income, but operating leverage is 1x.
With operating leverage of 2x, a 10% increase in revenue for firm A to $2.2 billion would result in operating income of $480 million. In contrast, firm B has operating leverage of 1x, which means a 10% increase in revenue to $2.2 billion translates to operating income of $440 million.
When sales are increasing for firm A, it means that operating income will increase for the firm more than the rate of growth in sales. However, when sales are falling for firm A, the operating income will fall at a rate more than the rate of fall in sales.
What impacts operating profits or margins?
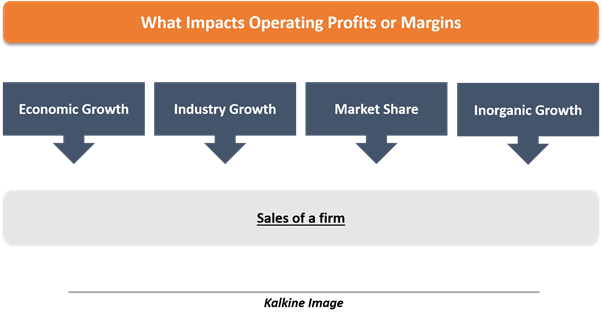
Although operating leverage defines the operating profits for a firm, there are many other factors that also impact the operating profits for the firms. These factors can be broadly classified into two categories: sales and economics.
Sales of a firm
Until now, we have argued that sales impact the operating profit of a firm, and the degree of the impact on operating profit is defined by operating leverage. Now we discuss how sales are impacted for a firm.

Economic Growth: Sales forecast for a firm is also based on the economic forecast of the region. When overall economic growth is expected to decline, it is highly likely that sales for the firm would also decline as a result. But this is not true for all businesses since non-cyclical businesses like consumer staples, the utility could remain unscathed from the decline in economic growth. Meanwhile, economic growth also sets the trajectory for the growth of the company.
Industry Growth: Sales of a company are likely to move consistently with growth in the industry. However, a firm could grow even while industry growth is declining, largely because of short-term factors like new business/product, acquisition, price competition. Forecasting industry growth remains crucial to forecast company sales, while the industry cycle is also important to consider.
Market Share: A firm can drive its sales when market share is increasing, and incumbent competitors are losing market share regardless of economic growth and industry growth. Firms are able to improve market share through product innovation, marketing, price wars etc.
Inorganic Growth: Companies could also increase sales through mergers and acquisition, while also getting rid of competition concurrently. The intent behind inorganic growth options is to improve market share, customer base and economies of scale.
Economics of a firm
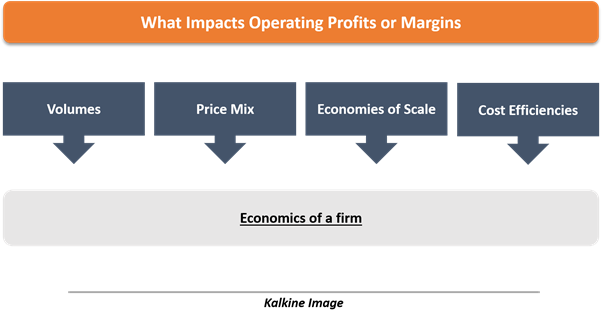
The impact of sales on profits is determined by the economics of the firm. Operating leverage is also a part of the economics of a firm along with other factor defined below.

Volumes: Earlier, we noted that a firm is required to increase the volume of production to lower the variable cost per unit. The growth in sales should also be backed by the increase in production to gain operating leverage.
Price mix: When firms have pricing power, they can increase the price of the products without losing much of the demand. Increase in price with a relatively smaller increase in quantity would add to the profit margins for the firm.
Economies of Scale: Companies exercise economies of scale when enhancement to processes and scale leads to lower per-unit cost of production. For example, when a large firm acquires a small firm, the marketing and sales could be integrated with a large firm, therefore saving costs incurred by the target company. Margin expansion through economies of scale is a result of the allocation of costs across larger volumes.
Cost efficiencies: Cost efficiencies could be achieved by the company irrespective of sales growth and contribute to the operating profit margin for a firm. This could be undertaken through innovation, research and development, therefore replacing old processes with new ones at lower costs.
 Please wait processing your request...