What is a Liquidity Ratio?
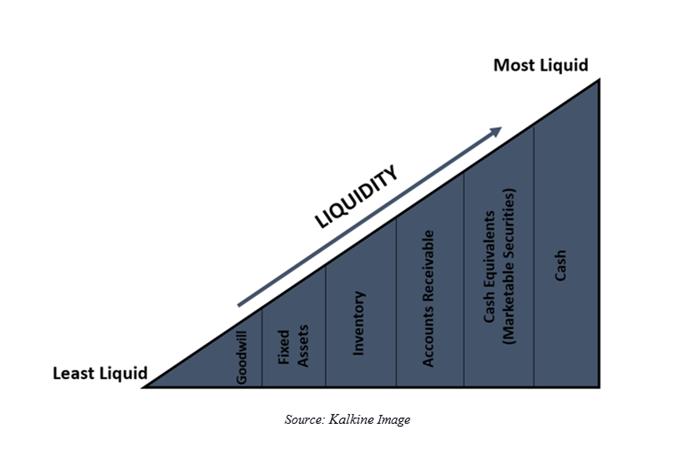
A liquidity ratio measures the short-term financial position of a firm by evaluating if the firm can meet its financial obligations due within the operating cycle or a year, with the utilisation of its current assets. The term ‘liquidity’ is used for denoting ease of conversion of an asset to cash quickly, without compromising its market value.
The quick access to cash, as highlighted by liquidity, should come handy, especially during financial setbacks, allowing the firms to immediately draw funds for meeting the instant obligations in the near future.
ALSO READ: Things to Learn from Past Crises: Role of Financial Planners During Times of Crisis

The high value of the liquid ratio denotes a high safety margin for the lenders and investors, ensuring them the creditworthiness of their investment.
Why is the Liquidity Ratio Used?
The creditors and investors use liquidity ratio for measuring if the company can meet the payment of their short-term dues without raising capital externally. The high liquidity ratio would help in pinpointing the investors that the company’s operations are sufficient in providing them with their regular short-term payments on their debts.
The experts can analyse the liquidity performance of the company using fundamental analysis through comparative evaluation. Significantly the comparative assessment can be performed by comparing the liquidity ratio of the same company in different periods or by comparing the performance of different companies operating under the same industry in the same period.
ALSO READ: Significance of Fundamental Analysis
While the intra-industry analysis helps in gauging the competitive performance of the company, the considerations of different periods for the same company can prove helpful in tracking the change in the company’s performance over time.
What are the types of Liquidity Ratios?
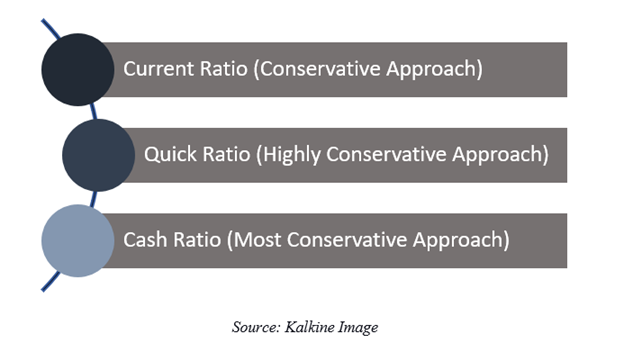
The liquidity ratios are common of three types, which includes current ratio, quick ratio and cash ratio.

- Current Ratio
The current ratio is an indicator of short term financial viability of the company. It updates whether the businesses have sufficient resources to pay off its shortterm obligations, that may fall due within a year. The ratio compares the current assets of the company with its current liabilities.
Current Ratio= Current Assets/ Current Liquidity
Current Assets include cash, cash equivalents, marketable securities, prepaid expenses, accounts receivable and other liquid assets including inventory which can be converted into cash within one year.
Current Liabilities include wages, accounts payable, tax payable, short-term debts, and other obligations due within a year.
The current ratio is also called as Working Capital Ratio, with its value more than one indicating that the company has positive working capital for carrying out its business.
Current ratio if high – is an indicator that the company holds the capacity to pay back its creditors for their short term/near term debt. While the low value of the ratio - can pinpoint at the weak financial health of the company, indicating that its operations are not generating enough to pay-off its short-term obligations with its current assets.
Significantly, many firms with high turnover and often working in cash have a low value of the current ratio. For example, retail stores or restaurants who have their customers paying up-front generate income quicker than they are required to pay-off their account’s payables. Thus, they pay their bills to the supplier using the cash generated and not keep large cash balances.
- Quick Ratio (Acid Test Ratio)
The quick ratio measures the company’s ability to meet its short-term financial obligations or current liabilities using its highly liquid assets (quick assets), which can be quickly converted into cash.
Quick ratio = Highly Liquid Assets that can be converted into cash within 90 days/ Current Liabilities
Highly Liquid Assets include cash and cash equivalents, accounts receivables and marketable securities.
Current Liabilities include the same components used in the current ratio.
By not taking into considerations inventory and other items used in the current assets which may prove challenging to liquidate, the quick or acid test ratio adopts a highly conservative approach.
- Cash Ratio
Cash Ratio is a step further from the quick ratio and the most conservative approach for evaluating the liquidity of the company.
Cash Ratio= Cash and Cash Equivalents/ Current Liabilities
Cash equivalents include the readily marketable securities. Current Liabilities includes the same component as that used in the current and quick ratio.
The creditors and lenders use this ratio to analyse that when the business falls at its worst, what proportion of the investment can be returned through most liquid assets. However, the high value of the cash ratio indicates holding a substantial amount of cash, which suggest that the company is not adequately utilising its liquid assets, which otherwise could have generated higher returns.
What is the Difference Between Liquidity and Solvency Ratio?
Liquidity ratio focusses on measuring the short-term performance of the company in terms of meeting its obligations due within a year. The Solvency ratio, on the other hand, evaluates the performance of the business operations from the long-term perspective to analyse if it can meet both its short-term and long-term obligations.
For example, the liquidity ratio would tell whether the company would be able to pay the current dues (interest charges) on long-term debt. The solvency ratio reveals if the company will be able to timely pay interest charges as well as repay the loan amount.
The solvency ratio considers a broader picture for ascertaining the health of the company.
Solvency risk is substantially high compared to the liquidity risk and can also lead to bankruptcy. Thus, the investors and creditors are often interested in analysing the solvency ratio to ensure that that their dues along with the principal amount would be met on time.
Significantly, the solvency ratio measures the cash flow of the company, including the non-cash expenses such as depreciation, amortisation for analysing the firm’s ability to sustain in the long run and pay-off its debts. Solvency ratios include debt ratio, debt to equity ratio, debt service coverage ratio and interest coverage ratio.
What are the Limitations of Liquidity Ratio?
- Limited to comparing companies within the same industry
The Liquidity ratios do not prove to be a useful measure for comparing business in two different sectors. For example, even the well-performing retailers and grocery stores may have their liquidity ratios comparatively lower than other type of businesses, which might not be doing that good. Since businesses differ between different industries, so current ratio comparison may not provide any productive insight. Furthermore, the liquidity ratio also cannot be used for evaluating the health of the business on a stand-alone basis.
- Prone to inconsistency due to Seasonality and Inflation Impact
Liquidity ratio uses the past data and fails to integrate the impact of inflation, therefore not being able to incorporate changes in the price levels. Furthermore, it can also be impacted by seasonality, demonstrating high liquidity for peak seasons and low liquidity for the off-peak season. The varying external factors influencing the value of the liquidity ratio to decrease its overall reliability for analysing business performance.
- Variability depending on the use of Inventory Accounting Method
Inventory accounting utilises different methods such as LIFO, FIFO, and Weighted Average Method. The value of the current assets, which includes inventory might vary depending on the technique utilised. It could create a discrepancy in the liquidity ratio value.
 Please wait processing your request...