What are Fibonacci numbers
Fibonacci numbers are a unique never-ending series of key numbers which were identified by a famous Italian mathematician Leonardo Pisano, later known by his nickname “Fibonacci” in the 13th century. What makes this sequence more interesting is that, all the numbers in this series are strongly related to the golden ratio.
In mathematics, two numbers are considered to have a golden ration when their ratio is very close or exactly equal to the ratio of their sum to the larger of the two numbers.
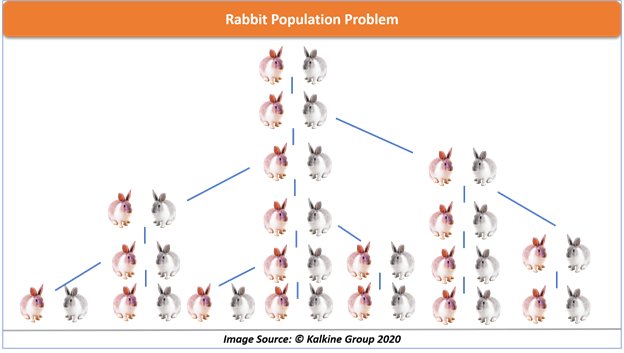
Fibonacci once experimented with this sequence while solving a rabbit population problem. He started with a pair of rabbit (male and female) and started exploring how many rabbits can be produced in a year if each pair produce one pair in a month.
Although a little bit unrealistic approach, this led to the widespread recognition to the Fibonacci numbers which we are familiar with today.
So what exactly are these numbers
Fibonacci numbers are a series of numbers where each number is exactly the sum of the previous two numbers. The formula to identify a Fibonacci number (denoted by F) is
F0 = 0, F1 = 1
Fn = Fn-1 + Fn-2
Let's take the actual series of Fibonacci numbers to demonstrate
1, 1, 2, 3, 5, 8, 13, 21, 34, 55, 89, 144
If you observe closely every number in the series is the sum of the preceding 2 numbers.
That is:
1 + 0 = 1
1 + 2 = 3
3 + 2 = 5 and so on…
Fibonacci ratio
The ratio between the two Fibonacci numbers is very close to the golden ratio but what’s more interesting is any two successive numbers in the entire series would be having almost the same ratio of 1.61 which is considered as a golden ratio.
For example
3/2 = 1.5, 5/3 = 1.66, 8/5 = 1.6, 13/8 = 1.62 and so on.
Diving further into these ratios, a remarkable consistency is seen when any Fibonacci number is divided by its immediate successor.
For example, (This time picking up Fibonacci numbers randomly)
89/144 = 0.61, 144/233 = 0.61, 377/610 = 0.61 and so on.
Practical application of Fibonacci numbers and ratios
The Fibonacci numbers and ratios are not only present in the mathematic books; they have their magic spread in nature too. Like.
- Number of petals in a flower (if all petals are intact) are generally in the Fibonacci number.
- No. of organs of a human body is also a Fibonacci number.
- DNA molecule measures 34 angstroms long by 21 angstroms wide, both of which are Fibonacci numbers.
Fibonacci numbers in the stock market
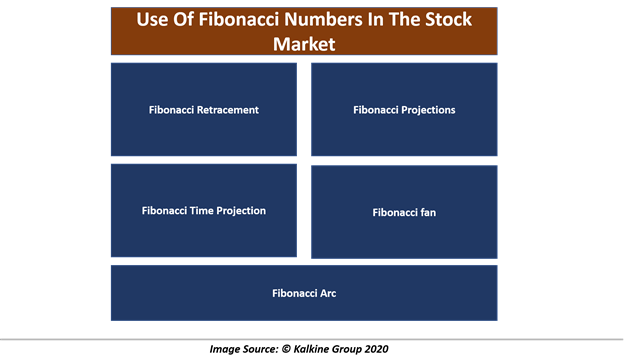
There is extensive use of Fibonacci numbers being carried out in the financial markets. A lot of tools have also been made upon these magical numbers which are used by many analysts around the world and are quite popular with the Elliot waves practitioners. Some of these tools are
- Fibonacci Retracement
Fibonacci retracements are probably the most widely used tool due to its simplicity in application and interpretation. The retracement levels are horizontal lines which depict the probable support and resistance areas based on the Fibonacci ratios. These are projected from the swing high to swing low.
This tool measures a specific price move from low to high in an uptrend and high to low in a downtrend to marks these levels on the chart with respect to that price move. The key levels to look for are 23.6%, 38.2%, 50%, 61.8%.
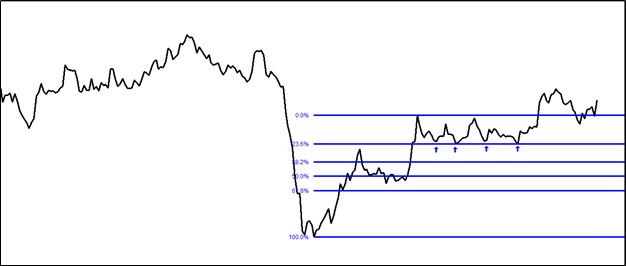
Image source: © Kalkine Group
As can be seen on the above chart, this asset under study has taken constant support at 23.6% retracement levels.
- Fibonacci Projections
Fibonacci projections is another tool which works on the Fibonacci ratios, but instead of measuring a retracement, it tries to project the potential move ahead, in the direction of the ongoing trend. To use theses projection levels analyst needs two waves, one to measure the magnitude of the move and the next wave, which would be the retracement of this wave. It is projected from the swing low to swing high.
The length of both the waves combined gives the projected levels where the market is expected to reach based on the Fibonacci ratio.
The key levels are 23.6 %, 38.2%, 50%, 61.8% 100%, 161%,
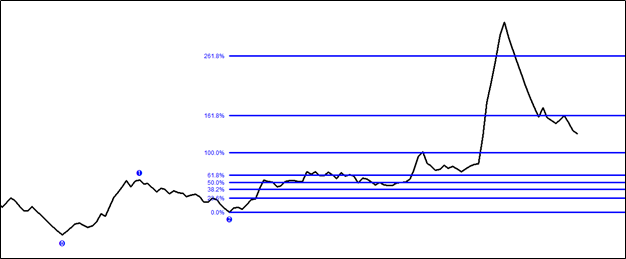
Image source: © Kalkine Group
The above chart shows projection levels considering Wave 1 (from 0-1) and wave 2 (from 1-2)
- Fibonacci Time Projection
The Fibonacci time projection tries to project the specific time period around which a major price change is expected to take place. The method of applying it is quite subjective.
The starting point of this tool is selecting a major swing high and swing low on the chart within the time frame of the analysis. Then the tool projects some vertical lines into the future, estimating another major swing high or low to be formed on the dates which meet those projection levels.
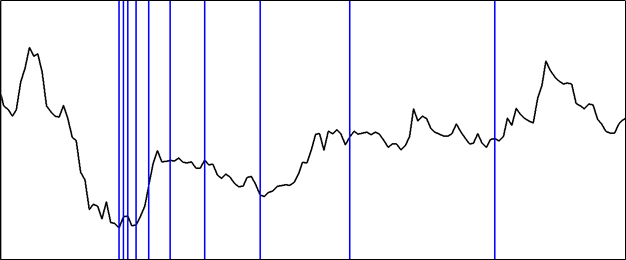
Image source: © Kalkine Group
In the above chart Fibonacci time projection can be seen plotted on a chart
- Fibonacci fan
The Fibonacci fan is essentially a combination of a few trendlines originating from the same point but with different angles of ascent. This gives the tool a fan-like appearance, hence its name. The slopes of these trendlines are drawn with respect to Fibonacci ratios of 38.2%, 50% and 61.%.
Once drawn, these trendlines extend into the future and act as a support or resistance as a normal trendline does.
The difference between the two is, the trendline is drawn based on price action but fan lines are projected based on Fibonacci ratio of ascent, irrespective of the price action.
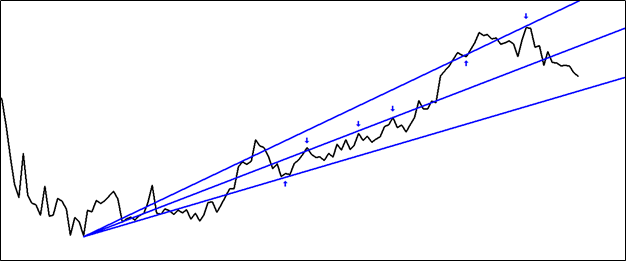
Image source: © Kalkine Group
Fibonacci fan lines working as support and resistance can be clearly seen on the above chart.
- Fibonacci Arc
Fibonacci Arc is relatively a little complex tool to use, and therefore, it is not widely used. However, the incorporated Fibonacci ratios do not make it any less worth than other Fibonacci tools. To plot these arches, a prominent high and low needs to be identified. Then a straight line is drawn connecting both the points which automatically plots a half-circle with the curved lines.
There arches intersect the line at 23.6%, 38.2%, 50%, 61.8% and more Fibonacci levels can be added. The point of intersection at these levels marks the support or resistance areas on the chart.
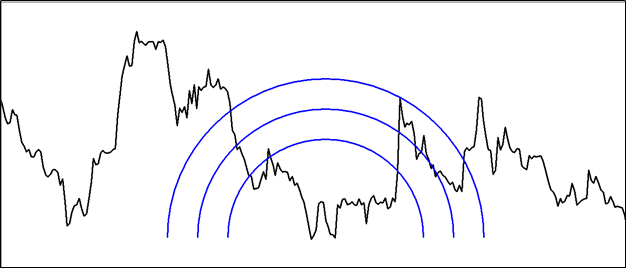
Image source: © Kalkine Group
Application of Fibonacci fan can be seen in the above chart.
Fibonacci Confluence
There are many more Fibonacci tools which an investor or a trader can use to effectively analyse the market. However, it is to be noted that none of these tools are infallible. Therefore, it is recommended to use various tools together, which increases the reliability if two or more tools conform to the approximate same analysis or projections.
 Please wait processing your request...