What is dark cloud cover?
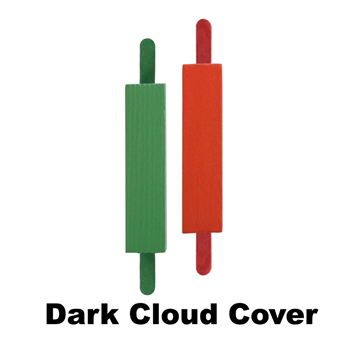
When a black or red candle opens above the close of the white or green candle and afterwards closes below the midpoint of the white or green candle, then it is known as the dark cloud cover. It is also known as the bearish reverse candlestick.
The dark cloud cover is significant in the stock market as it shows a shift from upside to the downside. This pattern is observed when an up candle is trailed by a down candle. A confirmation is received when the third candle further indicates lower prices.

Image source: © Somchaip | Megapixl.com
Summary
- When a black or red candle opens above the close of the white or green candle and afterwards closes below the midpoint of the white or green candle, then it is known as the dark cloud cover.
- It is also known as the bearish reverse candlestick.
- The dark cloud cover is significant in the stock market as it shows a shift from upside to the downside.
- A confirmation is received when the third candle further indicates lower prices.
Frequently Asked Questions (FAQs)
How dark cloud cover works?
When a large black candle is formed over a preceding up candle, then the dark cloud cover is observed. In a bearish market, the buyers increase the price of an asset at the beginning but at the later stage/session the seller takes over the market and by selling the shares, the prices are brought down sharply. With the shift in the prices from upward trend to downward trend or from buying to selling, a price reversal can be predicted from the downside.
The dark cloud cover is only considered useful by the traders when the downward trend is preceded by the rise in the prices or an uptrend. When the prices of stocks are continuously moving up, then the potential move towards the downside becomes important. When the price action is choppy, then it is likely that the pattern remains choppy afterwards and holds less significance for the traders.
The pattern will be marked as dark cloud cover pattern when:
- A bullish uptrend is existing.
- A Bullish (up) candle is present within the existing uptrend.
- On the following day, a gap up is present.
- The gap up observed converts into a bearish candle.
- Lastly, the down candle ends below the midpoint of the prior bullish (up) candle.
The dark cloud cover can be characterised as black and white candlesticks, these candlesticks have fewer shadows and long real bodies. The presence of white and black candlesticks suggests that the downward trend is decisive and is crucial from the price movement perspective. The traders generally look for confirmation by looking for a bearish (down) candle after the dark cloud cover. In case the bearish candle does not take place, then the dark cloud cover pattern might fail.
The end of the bearish candle is generally used for exiting the long position in the stock market. The trader might take the exit decision the next day if the price of the shares keep on declining, that is, a confirmation is received regarding the dark cloud pattern. A trader can use stop loss for protecting themselves, by placing the stop loss on the bottom of the bearish candle. Traders do not target profit when the dark cloud covers are forming.
The dark cloud cover can be used in conjunction with the technical analysis.
How to locate a dark cloud on a candlestick chart?
A trader should check the following aspect while confirming any dark cloud cover pattern-
- The existing trend is upward.
- The charts will give indications that the momentum of the prices is either reversing or slowing down. For example, the formation of the bearish candlestick indicates the reversal.
- Stocks will gap up. A red candle will be observed above the green candles, or on the same level or very close.
- The close of the red candle is lower than the midpoint of the preceding green candle.
- The trend can be confirmed if the downtrend continues.
What information is given by the dark cloud cover?
In a dark cloud cover, a bearish candle appears within the upward trend and the bearish candle opens above the bullish candle. This pattern indicates that initially buyers had control over the market and the buyers have pushed the prices high till the sellers take control. After this change in the momentum, the prices of the stock closes below the midpoint of the bullish (up and green) candle. The trend is only significant when it appears within an uptrend. Furthermore, the candles should have large bodies. The short bodies are generally ignored as they have no or very little strength to change or impact the overall momentum. The pattern finds significance when the bearish candle has no shadow and closes below the mid - point of the previous up candle.

The pattern loses its significance when it appears within a choppy market and is considered highly significant when it appears in an uptrend market. In an uptrend market along with the dark cloud cover, the traders generally exit the long position and to gain a better position, they enter a short position. Most of the traders generally wait for confirmation.
No calculations are involved as the dark cover are visual patterns. Therefore, while deciding upon the exit plan, a trader should also utilise technical analysis tools. Stop-loss can be used to protect oneself from declining prices. A relative strength index can be considered to predict the trend in the market. If the value is above 70, then a fall can be predicted.
What are the advantages and disadvantages of dark cloud cover?
Advantages – Dark clouds are easy to locate. The risk to reward ratio provided by dark cover is better than the bearish engulfing pattern. Also, the pattern can be observed in the beginning.
Disadvantages – The trader cannot take decisions solely based on the dark cloud-related information, and it should be accompanied by technical analysis tools. It is important that the pattern occurs at the top of the uptrend.
 Please wait processing your request...