What is the Capital Asset Pricing Model (CAPM)?
The capital asset pricing model (CAPM) calculates the expected return rate on an asset by considering the risk associated with it against the theoretical risk-free asset. CAPM was built upon the Modern portfolio theory, which evaluates the interrelationship between the expected return and risk associated with securities through correlation measure.
The idea around the entire model is to consider the risk-reward relationship, thereby allowing scope for more significant gains called risk premium in case of risky investments. A risk premium denotes a rate of return that is higher than the risk-free rate.
Thus, it helps investors add assets to make their portfolio well-diversified, taking into account the systematic risk or market risk (associated with the overall market) and specific risk (related to individual asset).
What are the Components of the CAPM formula?
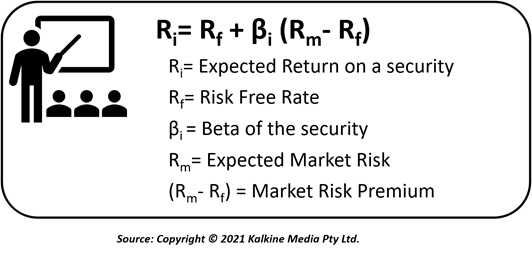
The CAPM takes into account the time value of money and the expected risk to estimate the expected return, which is calculated using the formula:

Expected Return (Ri)
The expected return of an investment, after considering various market-dependent variables, highlights the potential payback an investor would achieve in the long term through particular security or investment.
Risk-Free Rate (Rf)
The risk-free rate of return is a theoretical concept highlighting the return rate offered by securities with zero risks. The risk-free rate in real terms is generally calculated by deducting the inflation from yield on Treasury Bonds for a specific period (typically ten years).
Beta
Beta is used to gauge the volatility associated with the returns. Securities may show higher or lower fluctuation concerning the overall market. For securities having a beta greater than 1, their price fluctuation is higher than the average market fluctuation. On the other hand, for securities with a beta less than 1, the volatility is lower than the average market scenario. A beta value of 1 represents a perfect correlation with market risk, while -1 indicates a perfect negative correlation with the market.
Market Risk Premium
Market risk premium indicates return surplus in addition to what zero-risk security can provide in order to compensate for additional risk taken for a particular investment. Thus, the riskier the security, the higher is the market risk premium. Growth stocks or shares of companies with low market capitalisation offer comparatively higher return-rate in exchange for the elevated risk in comparison to the shares of large and stabilised companies.
What are the assumptions used in the CAPM?
The CAPM represents how financial markets behave, affecting the returns on investment. However, while analysing the return, it considers some of the assumptions:
- Asset quantities are fixed, and the security market competes ideally and efficiently with the necessary company or market-related information disseminated timely. Thus, all investors have homogenous information.
- Trading expenses, such as transaction cost and taxes, are not present.
- The market is perfect, with no restrictions on borrowing or short selling.
- Investors seeking to maximise their returns are rational and risk-averse.
- Risk-free rate remains constant over the discounting period.
- Return from securities follows a statistical nature (normal distribution)
What are the uses of the CAPM?
Due to varying assumptions, the CAPM appears to be more suited for an ideal condition and not the real-world scenario where various market imperfections are present. Despite the assumptions it uses in calculating the expected returns, it has multiple advantages associated with it.
CAPM offers a simplified measure to calculate the cost of equity, guiding the investors to evaluate the return conveniently.
The concepts and relationships used in the model highlight how market risk, return, and volatility determine the overall return.
CAPM concepts can be used as a toolkit to get a big picture of overall future returns. Thus, investors can use it to evaluate the returns and compare them against their expectations for better decision-making.
The model is a measure for comparing the expected performance of varying financial securities. The returns with respect to the rest of the market can also be compared.
It allows for building a well-diversified portfolio by using the combination of risky stocks that reduce the portfolio's overall volatility relative to its competent securities.
 Please wait processing your request...