
Yieldmax Meta Option Income Strategy ETF
FBY is designed to fulfill the primary objective of generating monthly income for investors while providing exposure to the price movements of Meta Platforms stock (META), with a cap on potential investment gains. Employing a synthetic covered call strategy, the fund utilizes a combination of standardized exchange-traded and FLEX options, incorporating three essential elements: i) synthetic long exposure, ii) covered call writing, and iii) US Treasuries.
The synthetic long exposure component of FBY seeks to replicate the price fluctuations of META by executing buying and selling activities of at-the-money call and put options, typically with maturities ranging from six months to one year. To generate income, the fund engages in writing call options with an expiry of one month or less, and with strike prices set approximately 5%-15% higher than the prevailing share price of META. This strategy is intended to limit the fund's potential gains in case the value of META shares experiences an increase.
Conversely, the short put positions within FBY expose investors fully to the downside risk associated with META stock. Furthermore, the fund maintains holdings of cash and short-term Treasury securities as collateral. It is essential to highlight that FBY does not directly invest in Meta Platforms stocks, thus investors do not receive any dividends from META.
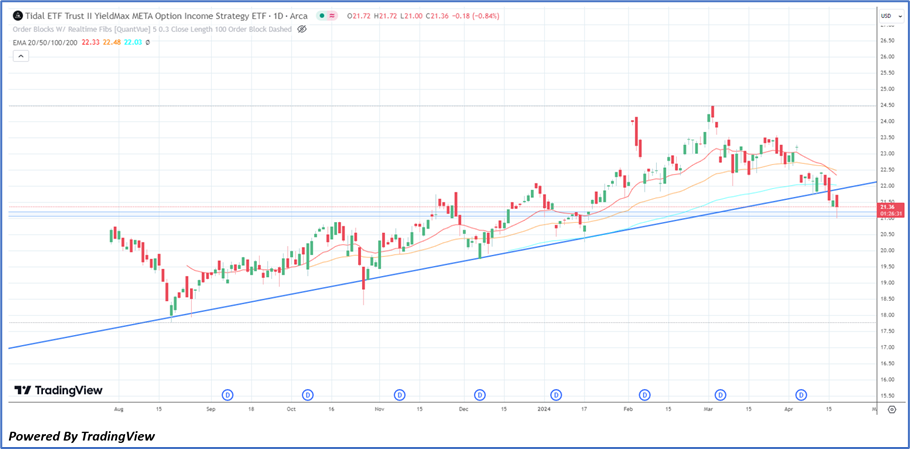
Technical Observation (on the Daily chart):
The FBY stock has experienced a breakdown of a significant trendline support level, which it later retested and expectation of a continuation of downward trend. This could potentially indicate a prolonged period of consolidation before any significant upward trend occurs. The 14-day Relative Strength Index (RSI), a momentum indicator, currently stands near oversold zone at 34.12 levels, indicating a negative outlook. To forecast future price movements, it is essential to keep a close eye on these factors and their potential influence on the stock's performance.
Individuals can evaluate the stock based on the support and resistance levels provided in the report in case of keen interest taking into consideration the risk-reward scenario.
Markets are trading in a highly volatile zone currently due to certain macro-economic issues and prevailing geopolitical tensions. Therefore, it is prudent to follow a cautious approach while investing.
Related Risk: This report may be looked at from a high-risk perspective and a recommendation is provided for a short duration. This report is solely based on technical parameters, and the fundamental performance of the stocks has not been considered in the decision-making process. Other factors which could impact the stock prices include market risks, regulatory risks, interest rates risks, currency risks, social and political instability risks etc.
How to Read the Charts?
The yellow colour line reflects the 21-period simple moving average (SMA) while the blue line indicates the 50- period simple moving average (SMA). SMA helps to identify existing price trends. If the prices are trading above the 21-period and 50-period moving average, then it shows prices are currently trading in a bullish trend.
The orange colour line in the chart’s lower segment reflects the Relative Strength Index (14-Period) which indicates price momentum and signals momentum in trend. A reading of 70 or above suggests overbought status while a reading of 30 or below suggests an oversold status.
The red and green colour bars in the chart’s lower segment show the volume of the stock. The volume is the number of shares that changed hands during a given day. Stocks with high volumes are more liquid than stocks with lesser volume as liquidity in stocks helps with easier and faster execution of the order.
The Orange colour lines are the trend lines drawn by connecting two or more price points and used for trend identification purposes. The trend line also acts as a line of support and resistance.
Technical Indicators Defined: -
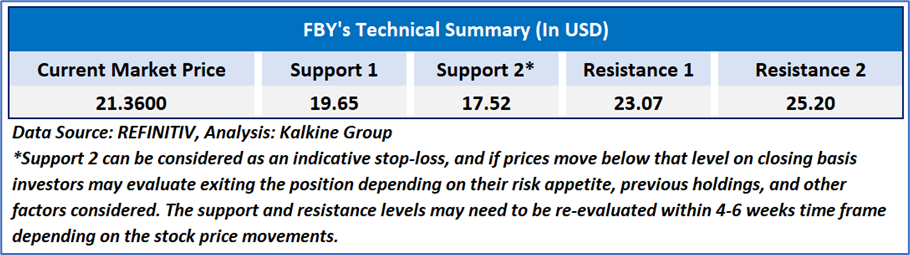
Support: A level at which the stock prices tend to find support if they are falling, and a downtrend may take a pause backed by demand or buying interest. Support 1 refers to the nearby support level for the stock and if the price breaches the level, then Support 2 may act as the crucial support level for the stock.
Resistance: A level at which the stock prices tend to find resistance when they are rising, and an uptrend may take a pause due to profit booking or selling interest. Resistance 1 refers to the nearby resistance level for the stock and if the price surpasses the level, then Resistance 2 may act as the crucial resistance level for the stock.
Stop-loss: It is a level to protect further losses in case of unfavourable movement in the stock prices.
Past performance is neither an indicator nor a guarantee of future performance.
The reference date for all price data, currency, technical indicators, support, and resistance levels is April 17, 2024. The reference data in this report has been partly sourced from REFINITIV.
Abbreviations
CMP: Current Market Price
SMA: Simple Moving Average
RSI: Relative Strength Index
USD: United States dollar
Note: Trading decisions require a thorough analysis by individual. Technical reports in general chart out metrics that may be assessed by individuals before any stock evaluation. The above are illustrative analytical factors used for evaluating stocks; other parameters can be looked at along with additional risks per se. Past performance is neither an indicator nor a guarantee of future performance.
Kalkine Equities LLC provides general information about companies and their securities. The information contained in the reports, including any recommendations regarding the value of or transactions in any securities, does not take into account any of your investment objectives, financial situation or needs. Kalkine Equities LLC is not registered as an investment adviser in the U.S. with either the federal or state government. Before you make a decision about whether to invest in any securities, you should take into account your own objectives, financial situation and needs and seek independent financial advice. All information in our reports represents our views as at the date of publication and may change without notice.
Kalkine Media LLC, an affiliate of Kalkine Equities LLC, may have received, or be entitled to receive, financial consideration in connection with providing information about certain entity(s) covered on its website.
Past performance is not a reliable indicator of future performance.
 Please wait processing your request...