
Medifast, Inc.
Company Overview: Medifast, Inc. (NYSE: MED) is a global health and wellness company that makes and distributes nutritional products and plans to assist people in losing weight, maintaining weight, and leading a healthy lifestyle. It operates in the United States and Asia Pacific (Hong Kong and Singapore) through its community, OPTAVIA, where its coaches teach the skill of establishing holistic, healthy habits through its unique "Habits of Health" Transformational System. It uses a direct-to-consumer sales approach to market its products and services, and subscription-based meal-plan orders account for 91.9% of its overall income.
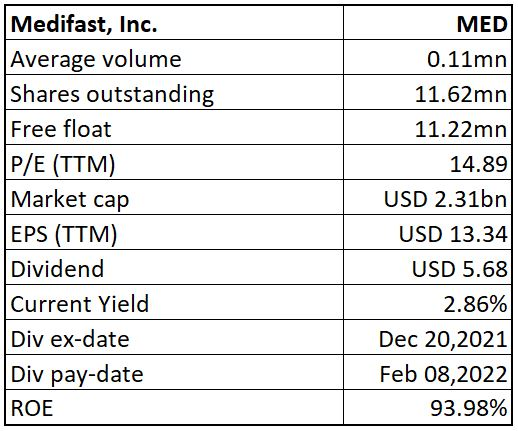
MED Details


Key Takeaways from Q3FY21 (ended September 30, 2021)

Revenues & Gross Profit Key Highlights; Analysis by Kalkine Group
Recent Developments
Steady Dividends:

Consistent Dividends (Data Source: REFINITIV)
Balance Sheet & Liquidity Position
Key Metrics: In Q3FY21, MED's ROE and reinvestment rate were 24.5% and 15.0%, compared to the industry median of 5.4% and 3.0%, respectively. Net Margin stood at 10.2% in Q3FY21 vs. industry median of 8.0%.

Return Metrics; Analysis by Kalkine Group
Top 10 Shareholders: The top 10 shareholders together form around 50.94% of the total shareholding, while the top 4 constitute the maximum holding. BlackRock Institutional Trust Co., N.A. and The Vanguard Group, Inc., hold the maximum stake in the company at 14.36% and 12.59%, respectively, as also highlighted in the chart below:

Top 10 Shareholders; Analysis by Kalkine Group
Risk Analysis
Outlook:
Valuation Methodology: Price/Earnings Per Share Multiple Based Relative Valuation (Illustrative)

Source: Analysis by Kalkine Group
*% Premium/(Discount) is based on our assessment of the company's NTM trading multiple after considering its key growth drivers, economic moat, stock's historical trading multiples versus peer average/median, and investment risks.
Stock Recommendation: Over the past six months, MED's share price has corrected 32.60%. The stock is currently leaning towards the lower end of its 52-week range of USD 184.48 to USD 336.99. We have valued the stock using the Price/Earnings multiple-based illustrative relative valuation method and arrived at a target price with an upside of low twenties (in percentage terms). We believe that the company can trade at a premium compared to its peer's average, considering its no-debt status, strong profitability, steady dividend yield, and underutilised CAPEX activity. We have taken peers like NU Skin Enterprises, Inc. (NYSE: NUS) and Edgewell Personal Care Company (NYSE: EPC). Considering the robust return profile, growth in topline, healthy balance sheet, encouraging outlook, associated risks, and current valuation, we give a "Buy" recommendation on the stock at the current price of USD 193.61, down 2.53% as of February 02, 2022, 12:25 PM ET.


MED Technical Chart, Data Source: REFINITIV
Note 1: The reference data in this report has been partly sourced from REFINITIV.
Note 2: Investment decision should be made depending on the investors' appetite for upside potential, risks, holding duration, and any previous holdings. Investors can consider exiting from the stock if the Target Price mentioned as per the valuation has been achieved and subject to the factors discussed above.
Technical Indicators Defined
Support: A level where-in the stock prices tend to find support if they are falling, and downtrend may take a pause backed by demand or buying interest.
Resistance: A level where-in the stock prices tend to find resistance when they are rising, and the uptrend may take a pause due to profit booking or selling interest.
Stop-loss: It is a level to protect further losses in case of unfavourable movement in the stock prices.
Kalkine Equities LLC provides general information about companies and their securities. The information contained in the reports, including any recommendations regarding the value of or transactions in any securities, does not take into account any of your investment objectives, financial situation or needs. Kalkine Equities LLC is not registered as an investment adviser in the U.S. with either the federal or state government. Before you make a decision about whether to invest in any securities, you should take into account your own objectives, financial situation and needs and seek independent financial advice. All information in our reports represents our views as at the date of publication and may change without notice.
Kalkine Media LLC, an affiliate of Kalkine Equities LLC, may have received, or be entitled to receive, financial consideration in connection with providing information about certain entity(s) covered on its website.
Past performance is not a reliable indicator of future performance.
 Please wait processing your request...