AAPL 165.84 0.5091% MSFT 400.96 0.461% GOOG 157.95 1.4321% GOOGL 156.28 1.4212% AMZN 177.23 1.4889% NVDA 795.18 4.3543% META 481.73 0.1372% TSLA 142.05 -3.4002% TSM 129.75 1.6053% LLY 731.33 0.6912% V 272.33 0.9452% AVGO 1224.46 1.6394% JPM 189.41 1.9429% UNH 491.23 -1.9755% NVO 125.26 2.0781% WMT 60.14 1.0247% LVMUY 168.89 0.4222% XOM 120.57 0.5756% LVMHF 851.89 0.4528% MA 456.75 0.2986%

Section 1.0: Key Metrics in Pictures
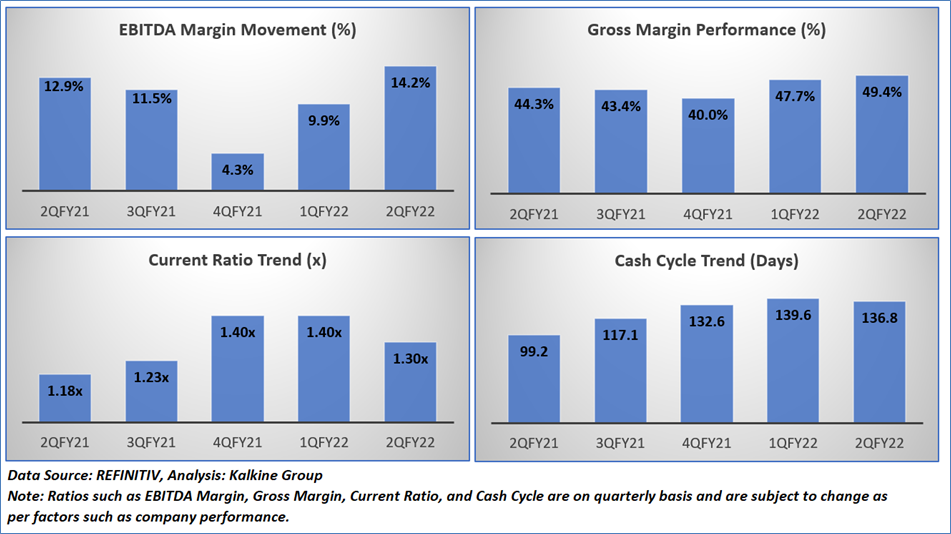
Having looked at the key financial metrics above the below sections provide an in-depth fundamental, and technical analysis on one Internet & Direct Marketing Retail Stock along with recommendation, technical support and resistance levels and indicative stop-loss.
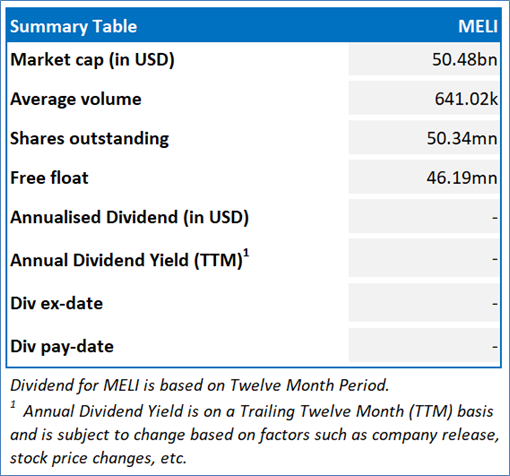
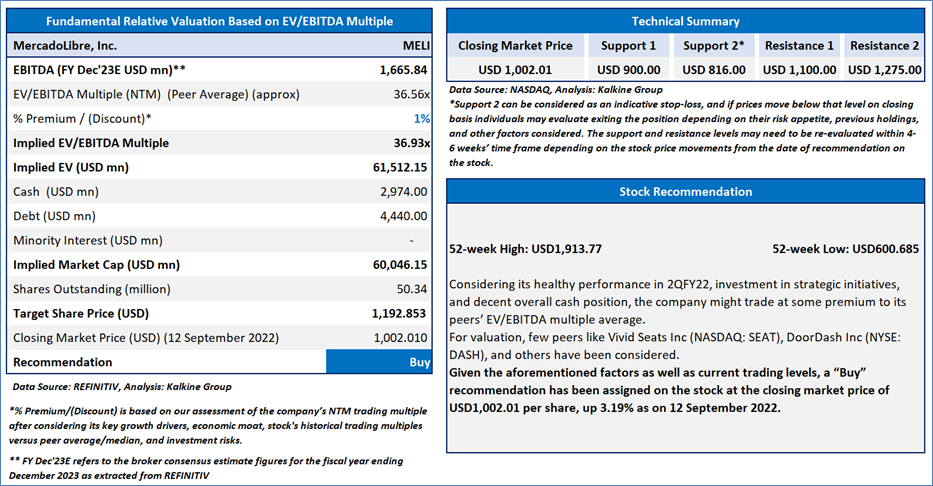
Section 2.0: MercadoLibre, Inc. (Buy at USD1,002.01 closing price as on 12th September 2022)
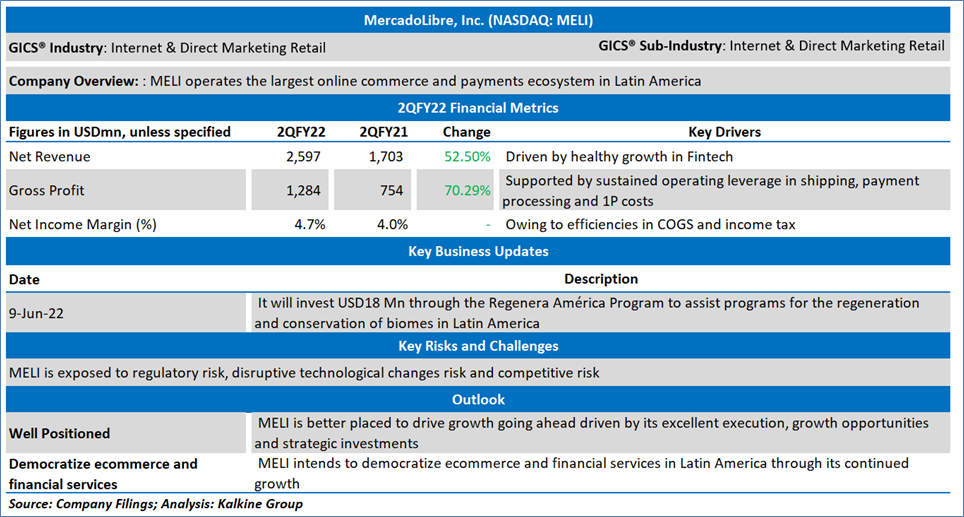
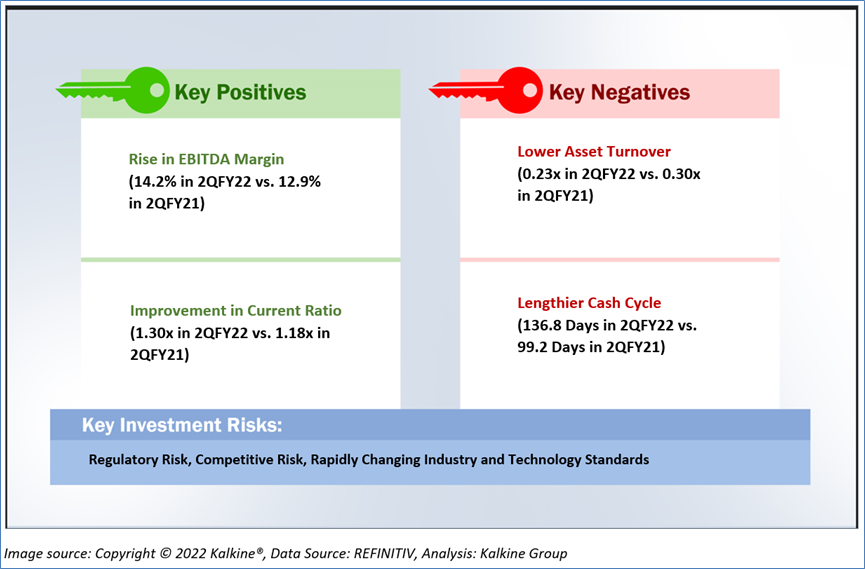
2.1 Company Details
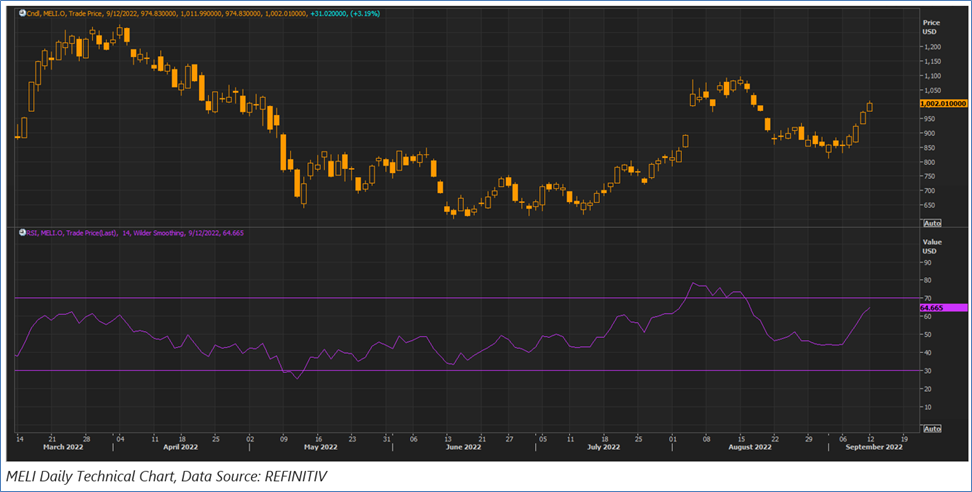
2.2 Valuation and Technical Guidance
MercadoLibre, Inc. (MELI) is a part of Kalkine’s Global Big Money Product
Markets are trading in a highly volatile zone currently due to certain macro-economic and geopolitical tensions prevailing. Therefore, it is prudent to follow a cautious approach while investing.
Markets are trading in a highly volatile zone currently due to certain macro-economic issues and geopolitical tensions prevailing. Therefore, it is prudent to follow a cautious approach while investing.
Note 1: Past performance is not a reliable indicator of future performance.
Note 2: The reference date for all price data, currency, technical indicators, support, and resistance levels is September 12, 2022. The reference data in this report has been partly sourced from REFINITIV.
Note 3: Investment decisions should be made depending on an individual's appetite for upside potential, risks, holding duration, and any previous holdings. An 'Exit' from the stock can be considered if the Target Price mentioned as per the Valuation and or the technical levels provided has been achieved and is subject to the factors discussed above.
Technical Indicators Defined: -
Support: A level at which the stock prices tend to find support if they are falling, and a downtrend may take a pause backed by demand or buying interest. Support 1 refers to the nearby support level for the stock and if the price breaches the level, then Support 2 may act as the crucial support level for the stock.
Resistance: A level at which the stock prices tend to find resistance when they are rising, and an uptrend may take a pause due to profit booking or selling interest. Resistance 1 refers to the nearby resistance level for the stock and if the price surpasses the level, then Resistance 2 may act as the crucial resistance level for the stock.
Stop-loss: It is a level to protect further losses in case of unfavourable movement in the stock prices.
 US
US  AU
AU UK
UK CA
CA NZ
NZ Please wait processing your request...